Update On Bitcoin: Price About to Move
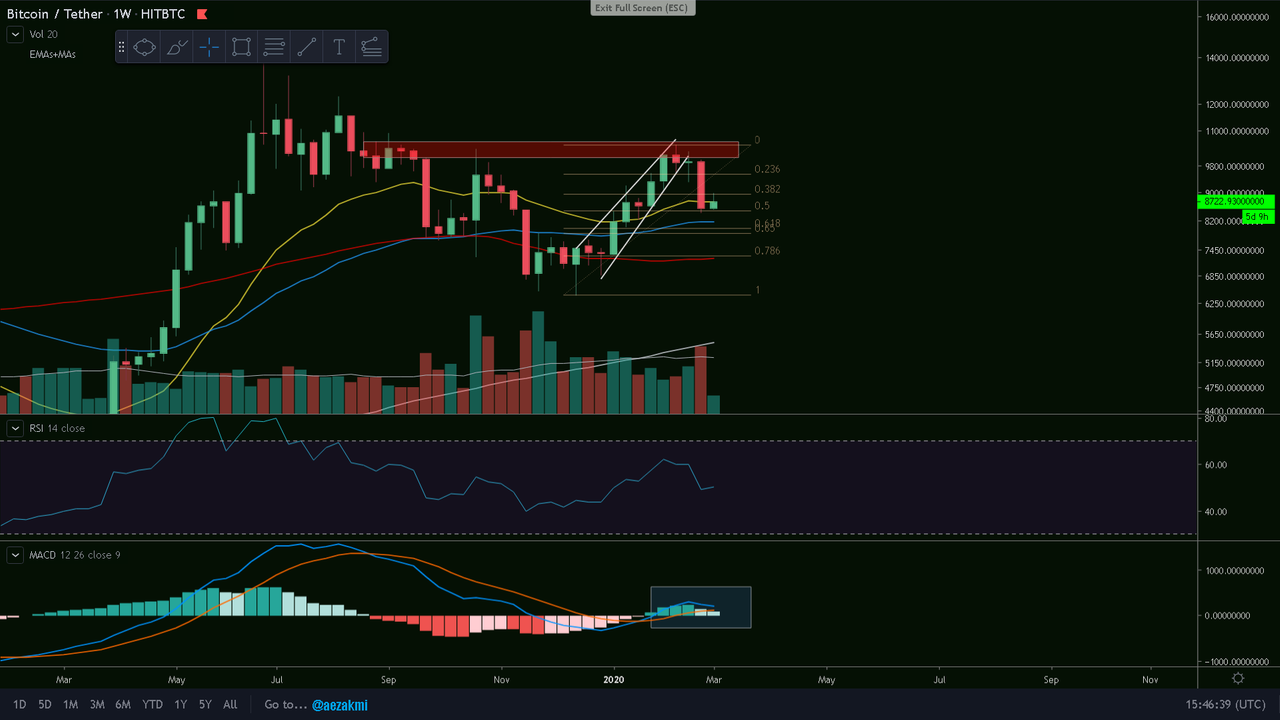
BTC/USD Weekly Chart
The long bearish candle brought us again under the 21 weekly EMA (yellow), but we've found support at the 0.5 Fibonacci retracement. We have a descending MACD-Histogram and if the 0.5 level won't hold us, our next stop is the 55 weekly EMA (blue), at 8200$, with possible wicks to the 0.618 Fib. retracement and the golden pocket area at 7850-8000$. A further price drop from that level would bring us to the 0.786 Fibonacci retracement, which aligns with the 100 weekly MA (red) - at 7300$. The worst case scenario is, of course, the 200 weekly MA (grey) - currently at 5500$.
Ctrl + Click here to enlarge the image in a new tab (steemitimages)
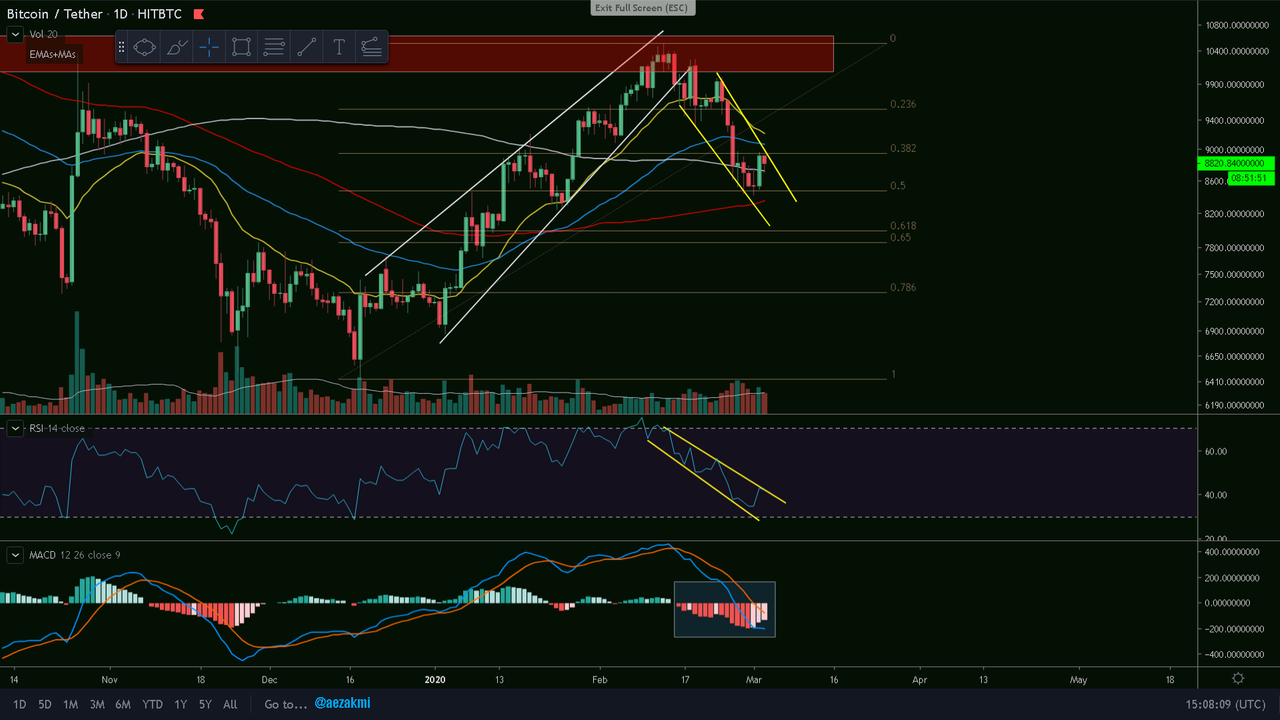
BTC/USD Daily Chart
Upon a closer look, we have an aggressive descending channel, on both the price action and the RSI, we have to get out of. The price is currently bouncing between the 0.382 Fib. retracement and the 200 daily MA (grey). Furthermore, we have a descending bearish MACD-Histogram, meaning that the bulls are re-entering the market. In the upcoming days I believe that we'll see some meaningful price action, indicating the trend of the market for the next period.
Ctrl + Click here to enlarge the image in a new tab (steemitimages)


Thanks for reading and safe trading!✌
If you find this post useful, please:

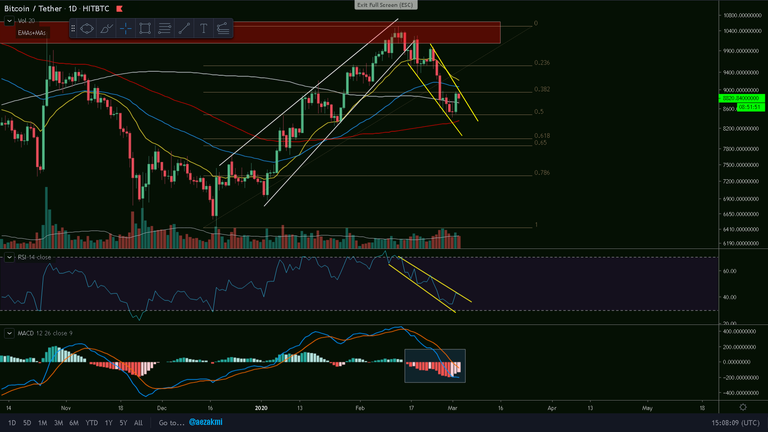
Update:
We're currently at the 200 day MA, with a MACD rejection at the signal line. If we break the 200 MA support, we will perhaps revisit 8200$
Ctrl + Click here to enlarge the image in a new tab (steemitimages)