SE Charts: STEEMSPEAK
Complaining is easy. Doing something about it is harder.
One thing I want to to see is a charting option within Steem Engine.
As a fourth chart I decided on the most explosive token created so far by the unstoppable Steem Viking @fyrstikken: STEEMSPEAK
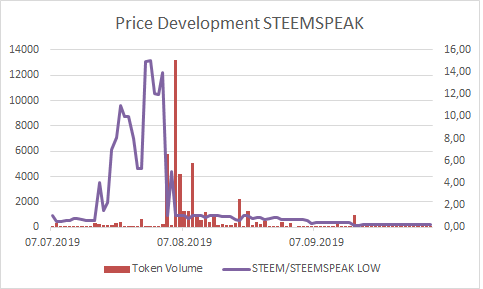
Left Y-Axis: Token Volume
Right Y-Axis: Steem/STEEMSPEAK
Horizontal Axis: Time
Time frame: 07.07.2019 until 03.10.2019
Price data is taken from daily lows.
Just from looking at this chart we can see that this token behaves in a peculiar way. In order to grasp what kind of hellfire the carrier of matches unleashed on SE, here are some tables and charts:
| Token Volume | Price Spread | High | Low | |
|---|---|---|---|---|
| Max | 13211 | 248,49 | 250 | X |
| Min | 1 | 0 | X | 0,1 |
| Median | 81 | 0,3 | X | X |
| Average | 531 | 7,57 | X | X |
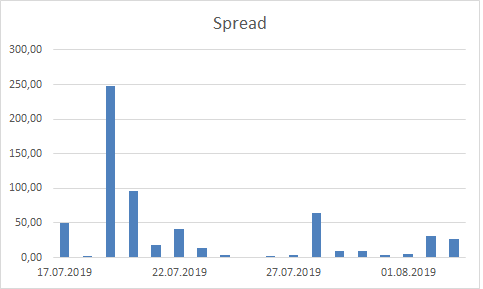
If we look at the difference between high and low prices - the spread - the median(1) looks healthy but the average does not.
Focusing on the particularly volatile period between 17.07.19 and 03.08.2019 we can see that the spread is way above the average of 7,6. During that particular time the median jumps to 12 and the average to 35,2.
The amount of tokens traded reacted more benign than the price action. Median increased to 137 and the average decreased to 497. The reason is that the large distribution date of 13211 tokens happened 2 days after the roller coaster stopped on 05.08.2019 and afterwards. The only large day with a significantly higher trading volume during that period happened on 03.08.2019 with 5776 tokens traded (hidden by the price curve).
Chart price action 17.07 to 03.08.19:
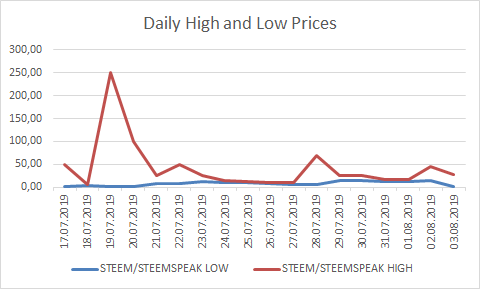
Chart spreads 17.07 to 03.08.19:
(1)
Median is the number where 50% of data points are either higher or lower. That makes it a lot more stable when confronted with extreme values in a data set. The average on the other hand can be skewed due to large outliers
Earlier posts in the series - ordered from newest to oldest:
SE Charts: DEC - Dark Energy Crystals
Feel free to make suggestions about SE tokens you want to see charted.
If you want to make charts on your own, go ahead and do it. It only takes a few, easy steps. Basic Excel skills is all you need. Mainly formatting data and charting.
@harpagon made two posts on how to get .json data from the API.
These are the steps:
- This is the call I used for the above data:
https://api.steem-engine.com/history/marketHistory?symbol=STEEMSPEAK - Convert the raw .json data into .csv:
https://json-csv.com/ - Convert the time stamp from Unix Time into human time in Excel with this formula:
=(((B2/60)/60)/24)+DATUM(1970;1;1)
B2 is a placeholder for the cell to be converted - Depending on your country settings you might have to convert the decimal format from '.' to ',' (from point to comma). It may be necessary to specify the format of date and numbers columns.
- Excel charting magic happens here
Ha en fin dag
.
Hi @bluerobo, a small upvote and a tip.
$trendotoken
Thanks for playing the ADDAX trading game!
Congratulations @addax, you are successfuly trended the post that shared by @bluerobo!
@bluerobo got 0.14491800 TRDO & @addax got 0.09661200 TRDO!
"Call TRDO, Your Comment Worth Something!"
To view or trade TRDO go to steem-engine.com
Join TRDO Discord Channel or Join TRDO Web Site
Can I has some too pretty please?
I'm the most deserving of !BEER on all of Steem. Thank you for noticing
Posted using Partiko Android
Command accepted!
You will soon be a whale beer.. or a beer whale?
I drink like a fish, you mean?
But whales aren't fish. Neither are dolphins.
Steem is confusing
Posted using Partiko Android
Where is my !BEER key?
Command accepted!
View or trade
BEER.Hey @bluerobo, here is a little bit of
BEERfor you. Enjoy it!View or trade
BEER.Hey @trumpman, here is a little bit of
BEERfor you. Enjoy it!That is the best TA I have seen so far on Steem!
Keep up the good work. One can clearly see the double down bowl with an upward inclined take away.
A fool who would act differently!
!BEER
Command accepted!
I need more !BEER to make sense of what you just said
Posted using Partiko Android
Command accepted!
One needs stronger drugs for TA.
!BEER is not enough
Command accepted!
View or trade
BEER.Hey @bluerobo, here is a little bit of
BEERfor you. Enjoy it!View or trade
BEER.Hey @isnochys, here is a little bit of
BEERfor you. Enjoy it!View or trade
BEER.Hey @bluerobo, here is a little bit of
BEERfor you. Enjoy it!Nice. Here's a !BEER for your effort
Command accepted!
View or trade
BEER.Hey @bluerobo, here is a little bit of
BEERfor you. Enjoy it!only you provide great details about se tokens thanks for sharing