SE Charts: LEO, LEOM, LEOMM
This project got started because Steem Engine is missing a charting functionality.
As you know, I'm happy to do charts on request. This isn't quite that. I found @trumpman shouting in the streets of Steem City - or is it Neoxian City - about LEO, miners and mega.
Now, before I tell you where, here is a Trigger Warning: @trumpman has a potty mouth and uses language your mom wouldn't be proud of.
An Update on my Leo Mega Miner Investment and Why You Should Buy Some
Let's find out if he is just yelling at pigeons or if there is something of interest going on.
As you are well aware, LEO is the native token of https://www.steemleo.com. A Steem tribe all about investing.
But what are miners? Here is a handy guide by @steem.leo Mine LEO Tokens Passively | Your Ultimate Guide to LEOMM and LEOM. Or this one by @rosatravels A Walk Through in Mining LEO with LEOMM.
In short: staking 1 LEO Miner (LEOM) gives you the chance of winning 1 of 30 LEO tickets per hour.
Staking 1 LEO Mega Miner (LEOMM) mines 4 times as much as LEOM.
Initially there were 250k LEOM tokens and 70k LEOMM tokens. LEO, LEOM and LEOMM are being burned at a rapid rate. For a quick valuation for LEOM or LEOMM based on the price of LEO, you will need to find out the current amount of tokens left in circulation. This information is displayed in the right side bar on the steemleo.com page.
You can find general information about Steemleo by following @steem.leo and @stats.leo
Earlier coverage of LEO
Check yourself before you wreck yourself
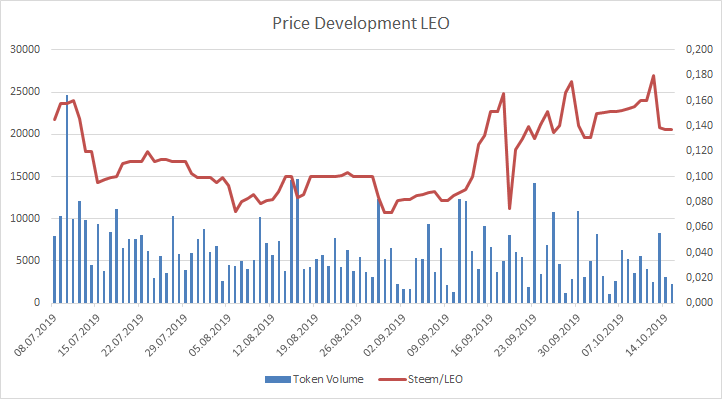
Left Y-Axis: Token Volume; Right Y-Axis: Steem/LEO
Time frame: 08.07.2019 until 15.10.2019
LEO data from the 03.07 until the 07.07 omitted because trading action at the token launch is not representative of regular trading.
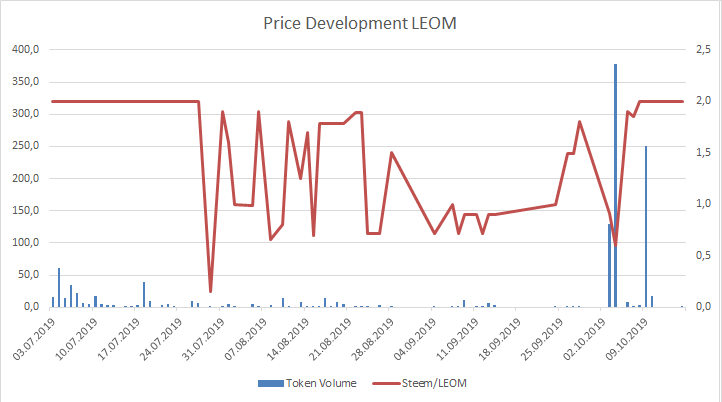
Left Y-Axis: Token Volume; Right Y-Axis: Steem/LEOM
Time frame: 03.07.2019 until 15.10.2019
LEOM is showing some volume spikes. To get a better grasp on trading: the median is 3 per day, the mean is extremely skewed to 18,8.
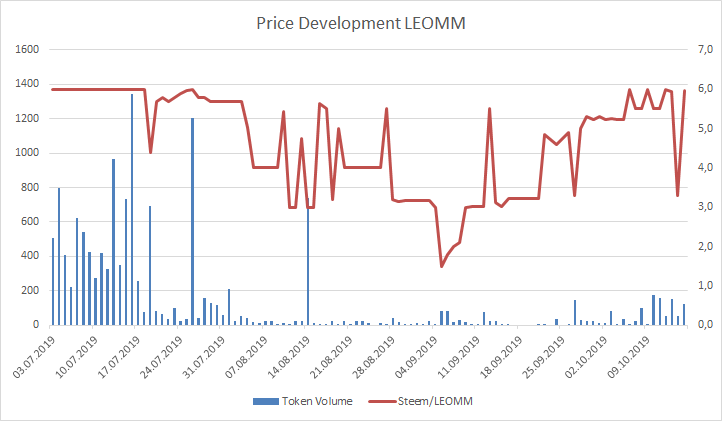
Left Y-Axis: Token Volume; Right Y-Axis: Steem/LEOMM
Time frame: 03.07.2019 until 15.10.2019
LEOMM is showing some very irregular volume. To get a better grasp on trading: the median is 27 per day, the mean is extremely skewed to 145.
Price data for LEO, LEOM and LEOMM is represented by daily lows in order to be conservative. Some tokens display a huge spread or sometimes don't trade at all. The daily low represents a bid where a transaction could happen.
Earlier posts in the series - ordered from newest to oldest:
SE Charts: DEC - Dark Energy Crystals
If you want to make some charts on your own:
Charting Ressources for SE Tokens
Disclaimer 1: Author is a LEO Minnow at the time of writing.
Disclaimer 2: These charts do not constitute investment advice. Especially not for @trumpman.
So nice to see this help for everyone, @bluerobo. I hope you will keep going with this great information and charting :)
@tipu curate 2
Upvoted 👌
Glad you enjoy it. Have a !BEER
Posted using Partiko Android
View or trade
BEER.Hey @fitinfun, here is a little bit of
BEERfor you. Enjoy it!!BEER BEEER and BEEEER
What?
!BEER ?
OK!
Posted using Partiko Android
View or trade
BEER.Hey @bluerobo, here is a little bit of
BEERfor you. Enjoy it!I wish I had more testicles to invest on Leo :(
You are already balls deep. Enjoy a !BEER
Posted using Partiko Android
View or trade
BEER.Hey @trumpman, here is a little bit of
BEERfor you. Enjoy it!This post was shared in the Curation Collective Discord community for curators, and upvoted and resteemed by the @c-squared community account after manual review.
@c-squared runs a community witness. Please consider using one of your witness votes on us here
I thought LEO was that scammy stable token that Bitfinex put out...
Dont shit talk @trumpman or youll get downvoted with the fury of a 1000 dildos.
You have been warned. 😠
Posted using Partiko Android
That's a hot take. Have a !BEER
I'm only aware of 1 pink dildo in his possession
Posted using Partiko Android
View or trade
BEER.Hey @lordbutterfly, here is a little bit of
BEERfor you. Enjoy it!Enjoy a modest $trendotoken from MAPX!
Also... New TULIP Mania Game Starts This Friday!
Sorry, @map10k you’ve reach daily limit of 10 successful TRDO calls!
Please try again tomorrow!
"Call TRDO, Your Comment Worth Something!"
To view or trade TRDO go to steem-engine.com
Join TRDO Discord Channel or Join TRDO Web Site