Build-it Stats | April 2020
Hi everyone and please welcome to our monthly stats. This is our April edition on the monthly stats.
After the March HardFork, April has been a month for consolidation and moving forward. The BUILD token and tribe has been moved over to HIVE and Hive-Engine in April. A lot of things still needs to stabilize and settle, but overall we can go back to business.

We will be looking at the number of tokens issued, top earners, staking, activity on the web, prices etc.
The following topics will be covered:
- Tokens distribution (Issued Build tokens),
- Top Earners for the month
- Staking and top Stakers
- Share of tokens staked
- Number of users
- Posts and comments activities on the platform
- Price Chart
Issued BUILD Tokens
Let’s take a look into token distribution, inflation and how it is distributed.
Below is a chart that represents the cumulative issued BUILD token.
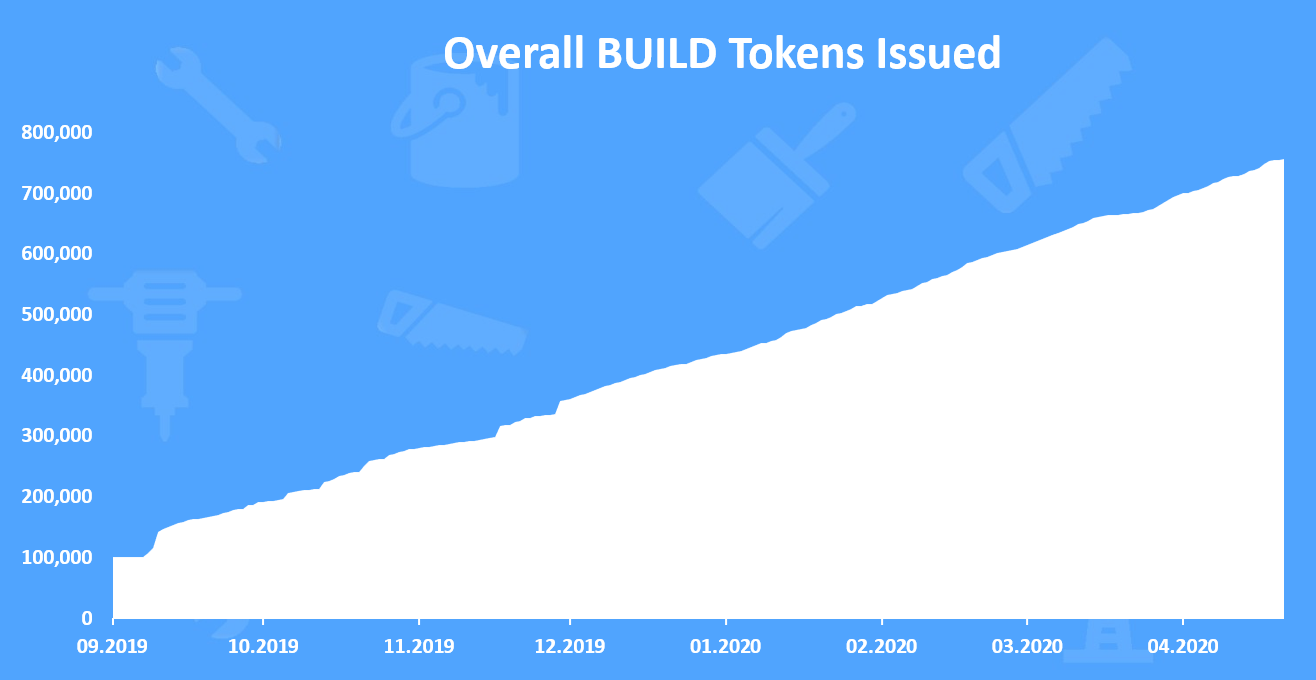
A total of 742k BUILD tokens issued till April 2020.
The number of tokens started with 100k and then growth over time.
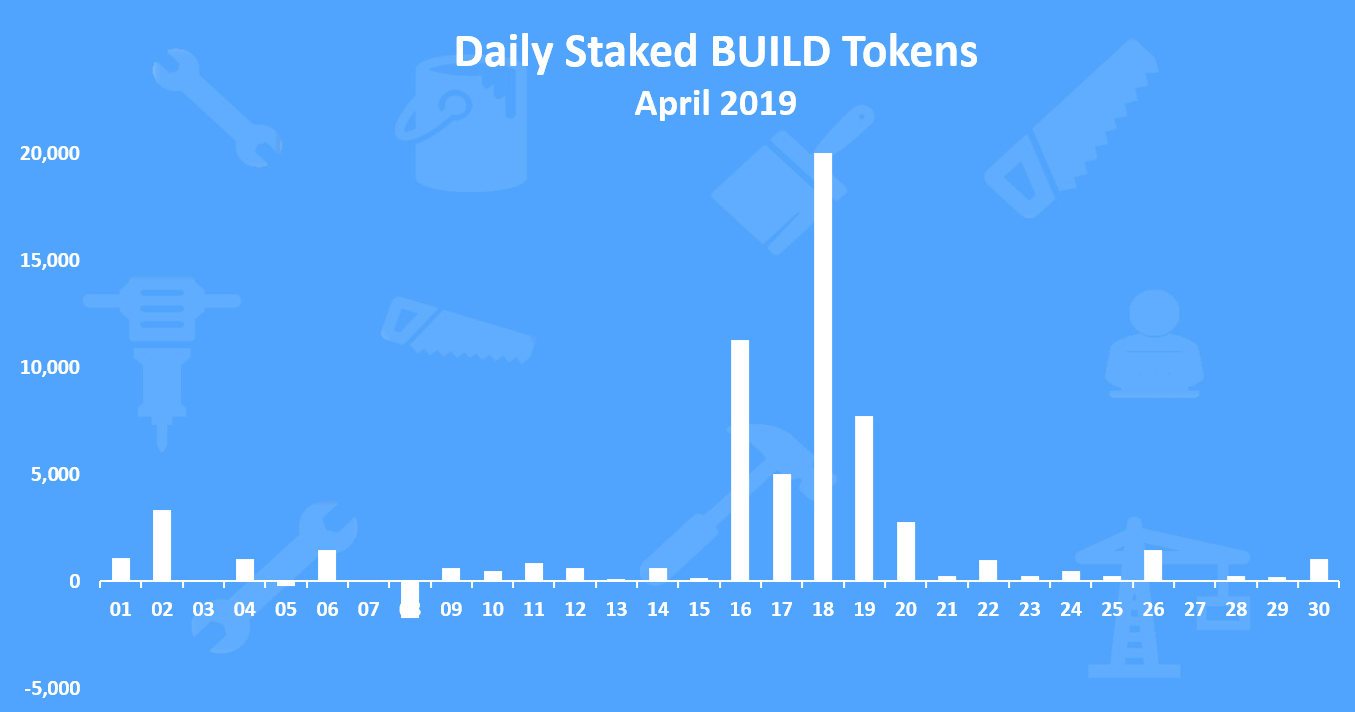
Now let’s see the daily issued tokens for April 2020.
Here is the chart.
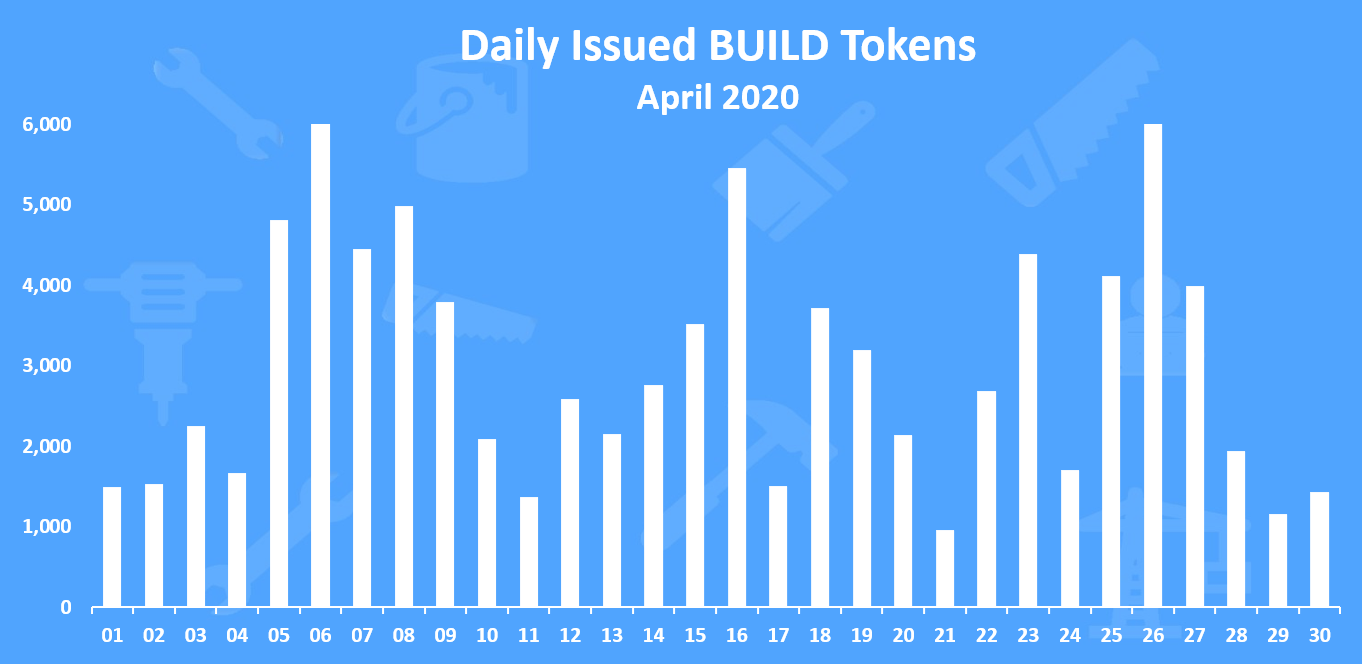
On average there is around 2600 BUILD tokens issued daily. In Aptil 2020 the total amount of issued BUILD tokens is 78k tokens.
Note: The transition to the Hive blockchain and Hive-engine, happen on 17 April, with all the tokens transferred from Steem-Engine to Hiven-Engine.
Top 10 BUILD Earners for the period
Now that we saw how the numbers on the tokens are issued let’s see how those are being distributed. How much do the top 10 received and how much the rest? How many accounts earned BUILD tokens?
Here is the chart of the Top 10 BUILD earners in the period.
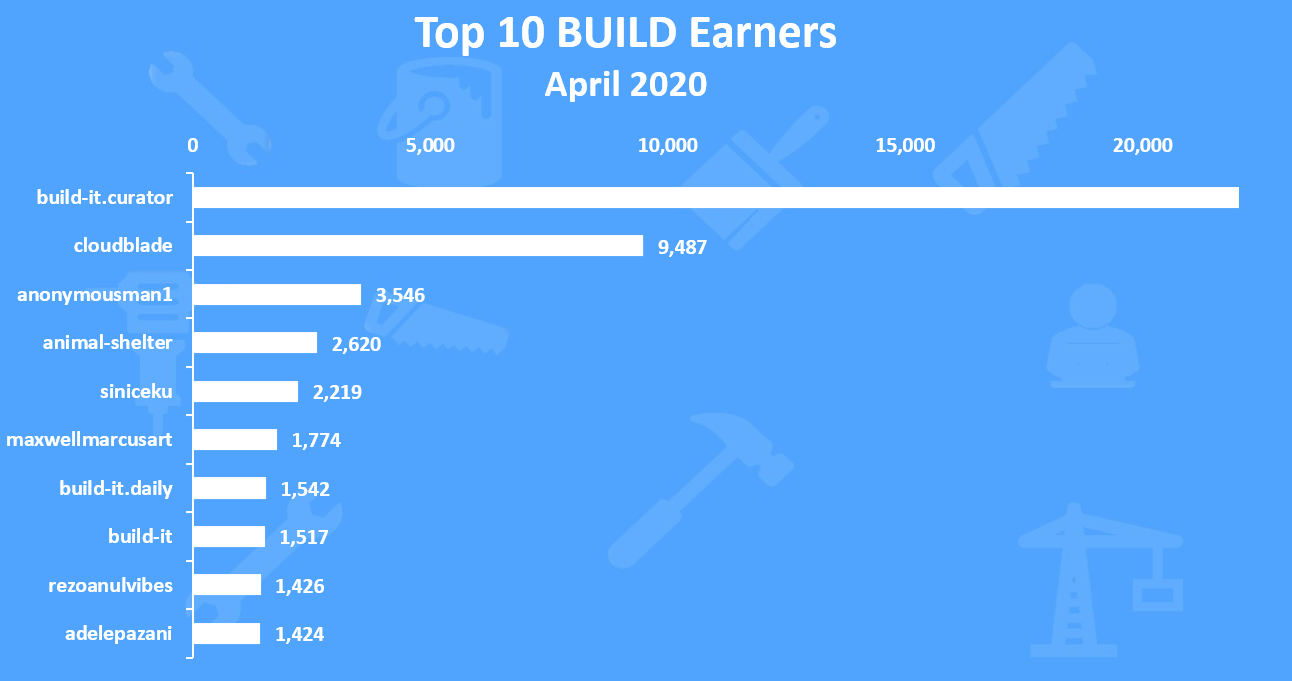
On the top is the build official account @build.it curator with 25k tokens, followed by @cloudblade with 9k tokens and @anonymousman1 with 3.5k tokens.
Staked Tokens
Staking is an important part of the tokenomics as it shows how much of the tokens are out of the market and put in use.
Below is the chart with overall BUILD staked tokens.
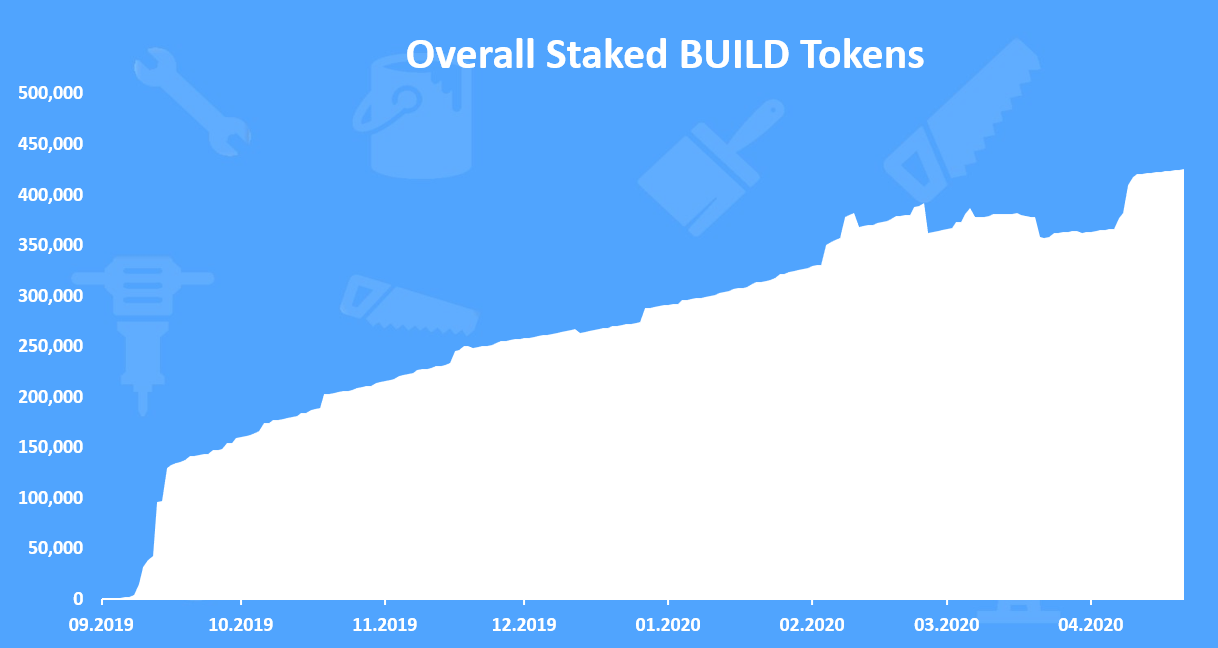
The staking started in September and it continue to grow since then.
We can notice that in the previous two months there is some instability happening due to the HardFork.
Now the daily staking for the last month.
Here is the chart of the net staked tokens for the month.
April has been a positive month in terms of staking, with a large staking happening after the transitioning to the Hive blockchain. A total of 67k net tokens positive staked in April.
Top 10 BUILD Stakers in the period
Who is doing the staking? Here is the chart of the Top 10 BUILD stakers in the period analyzed.
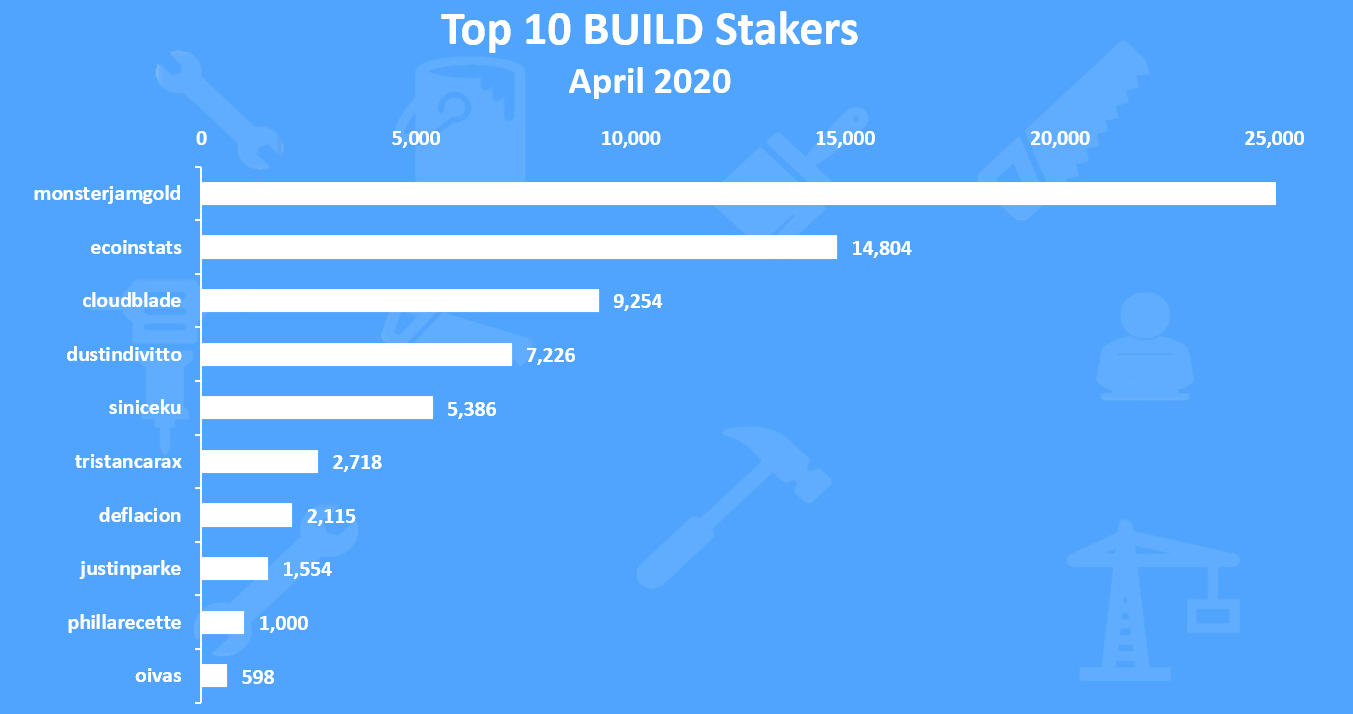
On the top is the build official account @monsterjamgold with almost 29k tokens staked, followed by @ecoinstats with 14k and @cloudblade on the third place.
Share of Tokens Staked
Below is a chart of the ratio staked/unstaked BUILD tokens.
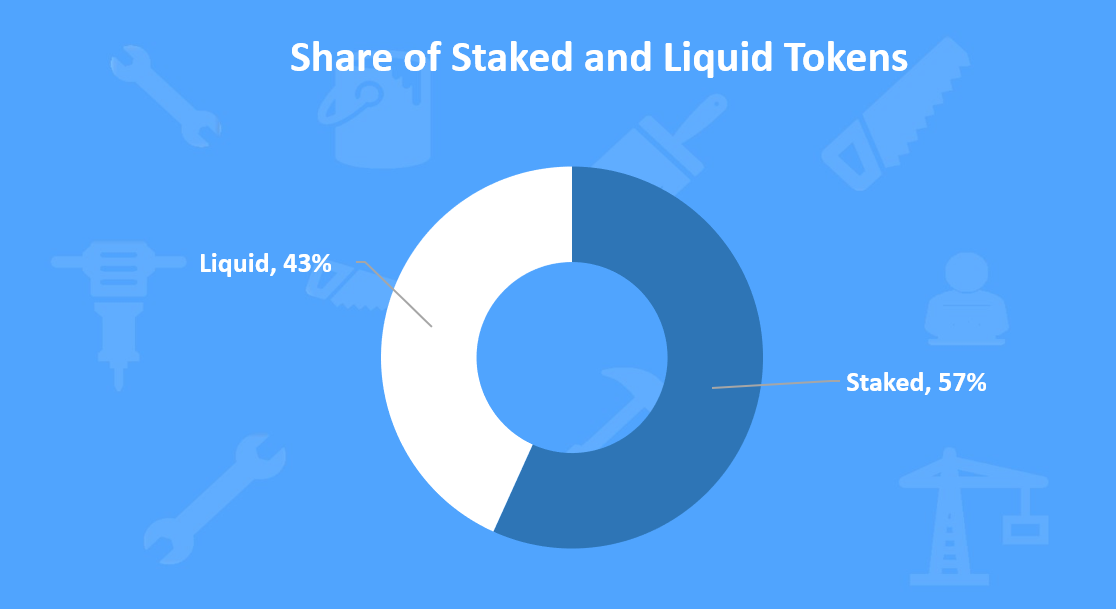
The share of the staked tokens is 57% and it is almost the same as the previous month.
Out of the current supply 740k tokens, around 420k are staked, and 320k are liquid at the end of April 2020.
BUILD Users
How is the BUILD community doing with the number of users?
Below is a chart with the number of unique users that posted on the Build-it web. These are users that posted directly from the web.
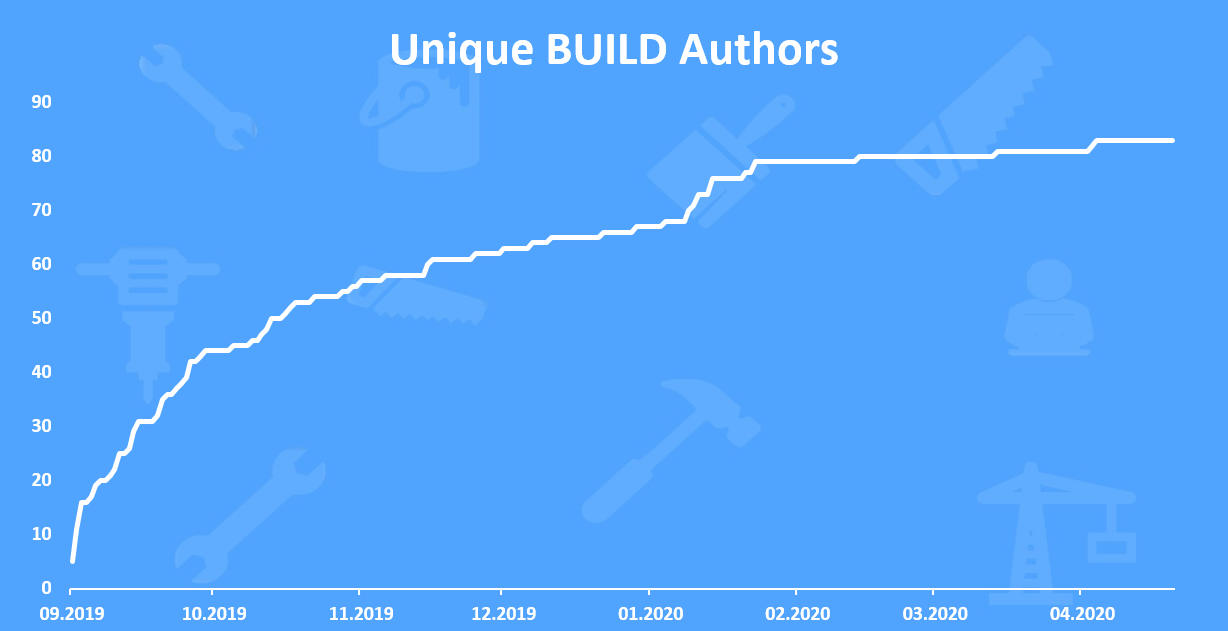
A total of 83 unique user have posted from the Build-it frontend.
The users who posted from other frontends and included the tag #build-it are not included in the chart above. The number is larger when those included.
Build it now has its own community as well:
Activities on Build-it
Below is a char of the activities on Build-it, including posting and commenting from the Build-it interface and posting and commenting with the #build-it tag.
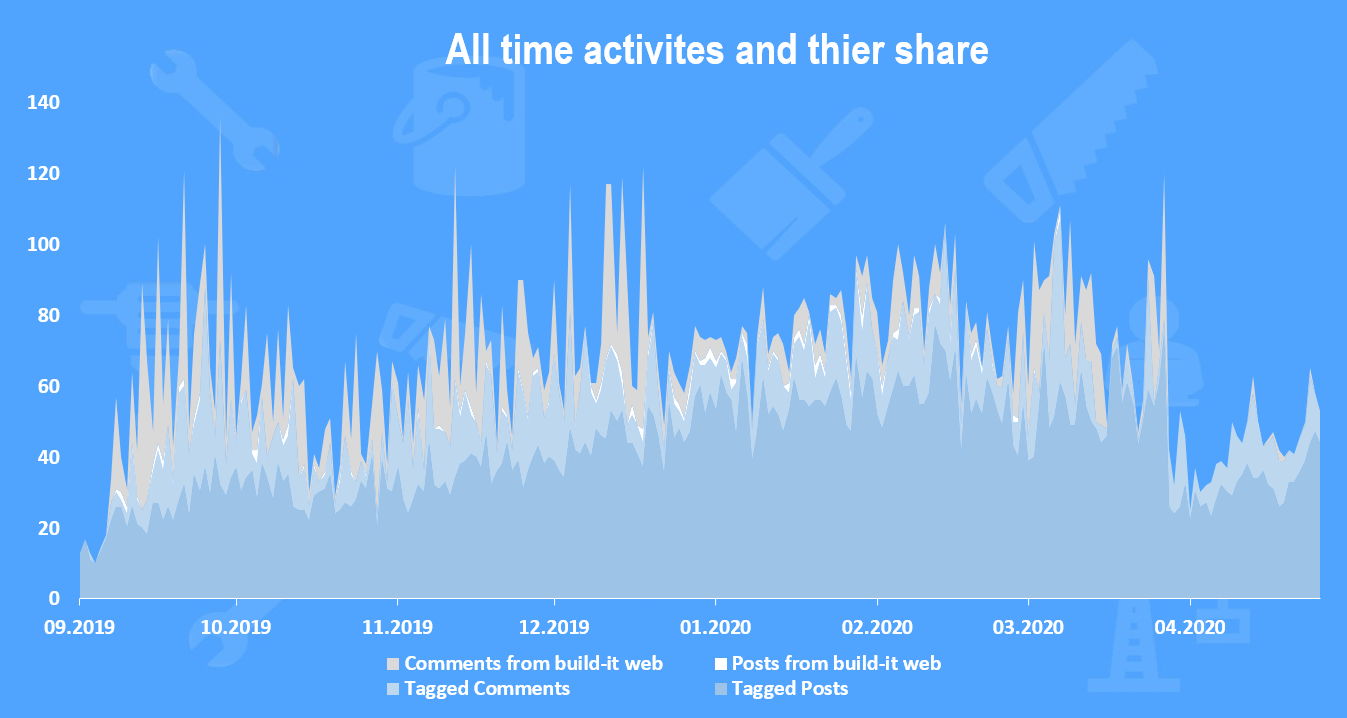
We can see that the majority of the posting still comes from other interfaces with the tag #build-it.
Posts and comments with the Build-it tag
Below is the chart on the posts and comments with the #build-it tag, in the period.
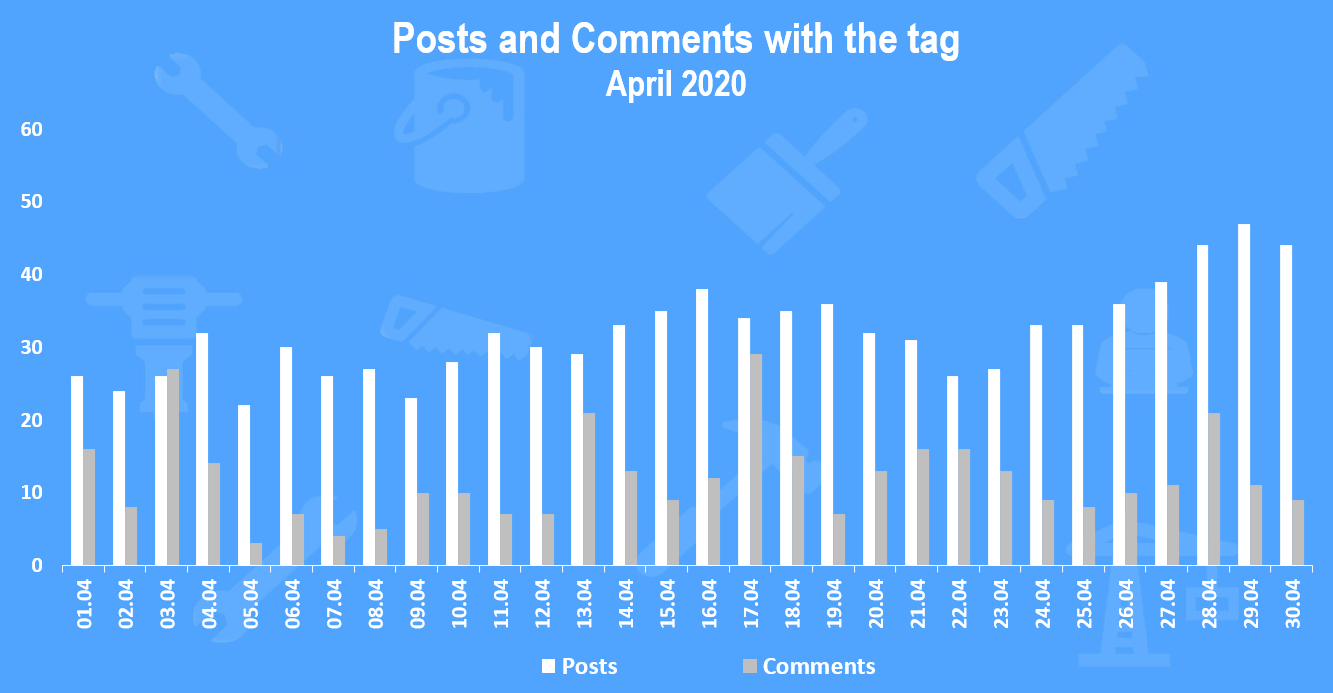
A total of 914 post in April with 352 comments with the #build-it tag.
Price
Here is the price chart for the BUILD token with daily candles.
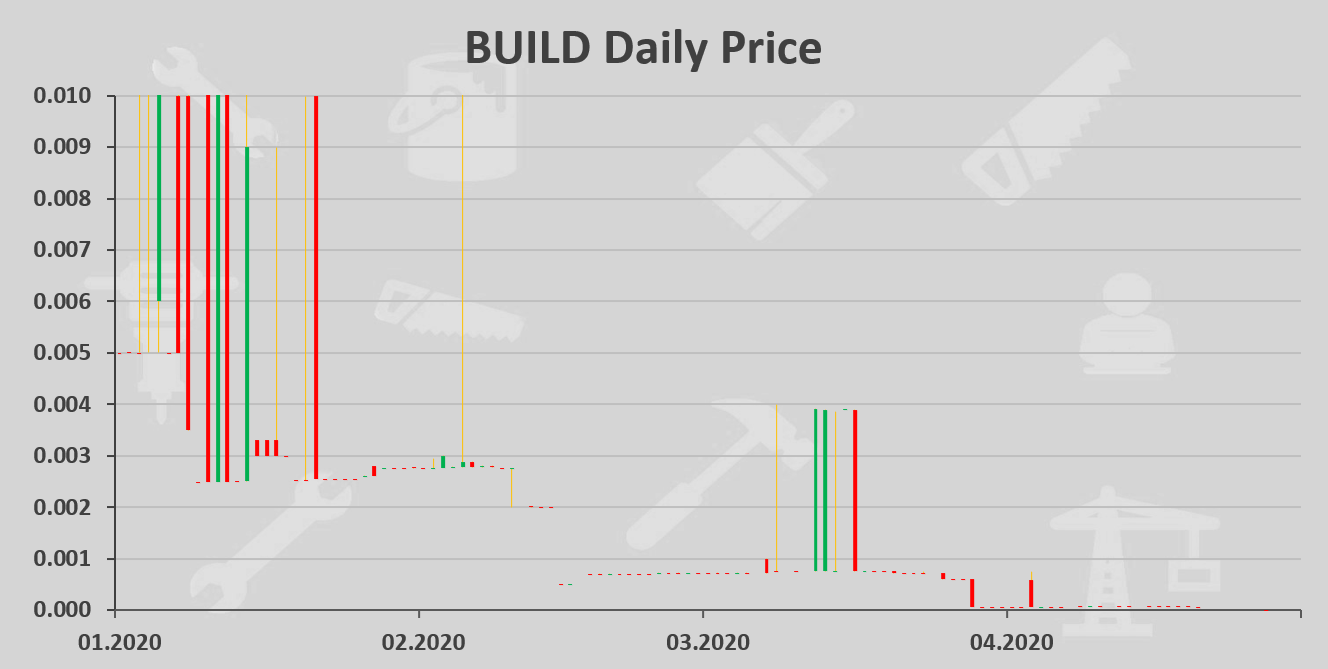
The chart is not very readable due to the large volatility and in the previous month the BUILD token dropped in price following the HF.

Hi! I am a robot. I just upvoted you! I found similar content that readers might be interested in:
https://medium.com/@buildit_DIY/build-it-stats-february-2020-34f0a7b40339
it turns out I have 7 thousand tokens left on the steem-engine