Yesterday’s 8% flash crash in Bitcoin price dwarfed by today’s 40% historic flash pump
Just when bitcoin was getting boring with all its sideways movement and gradual bearish slump in price action, we suddenly - out of the blue - get a moment yesterday of sudden losses followed just a few hours ago by today’s equally sudden explosion to the upside. Overall in the past 24 hours bitcoin has made one of the most powerful bullish moves in its 10 year history. This is it guys – moon landing incoming!

Source
Some jokingly call the chart pattern formed the “Bart” pattern, where a steep vertical drop down in price is followed by a sideways range-bound or horizontal move for a few hours, only to be met by an equally vertical pump upwards in price. The pattern created looks like the shape of Bart Simpson’s head. This is what we have on our price graphs today, the colloquial “Bart” pattern, except for the fact that the latest pump to the upside has way surpassed the former price range that leaves Bart with a long fringe of hair on the one side. This pump is something way beyond Bart.
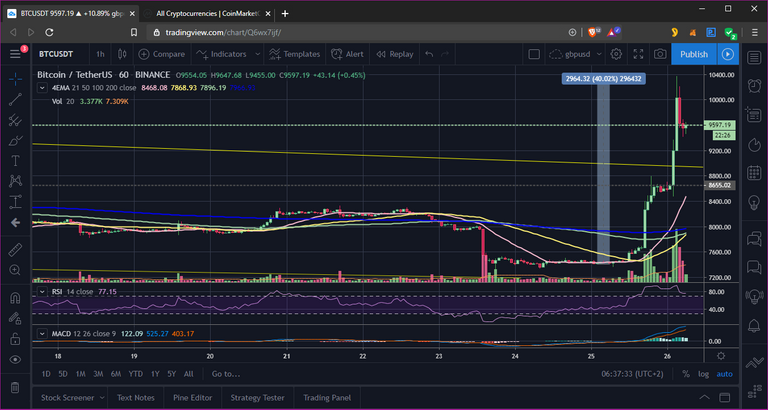
Beside that odd image, we have what seems to be something truly volatile happening in Bitcoin price action at present. Much of the recent bearish retracement in price in what was presumed to be a bull market, has been negated by today’s massive price pump from $7400 to $8800 at one point, or a rise of over 18%. And here I was thinking that we had lost the bull run for a while. Actually we did, but it may be back. And then six hours later we have another 20% pump, taking bitcoin price all the way up to $10400, though it has since settled back to $9500 or thereabouts.
Ever the cautious conservative lately in bitcoin technical analysis, I will refrain from attempting to call it like it is because sometimes it isn’t what you think it is. Yesterday it was a major bearish sentiment sweeping the cryptoverse and within 24 hours we are back in a bullish mood, backed by the massive green volume candles seen in the last 12 hours during the pump today.
A price spike like this of over $1300 in one day and then another $2500 within two hours is very rare, even for bitcoin, and it suggests that the previous dump was an anomaly and this is the real sentiment waiting behind the scenes – one of eager investors aiming to go long or buy up any and every dip in bitcoin price. This first boost back up to $8800 retraced slightly to the $8500 region and then six hours later pushed up to a massive $10400 for a few minutes.
We now find ourselves and the bitcoin price right up beyond longterm descending wedge pattern in play since the recent peak around $14000 in July. This descending wedge is narrowing or tightening by the week and price is now near the top of it. Since price broke up out of this descending wedge pattern, we have seen some further explosive “uptrend” and much more bullish momentum. After all, price range has been tightening like a coiled up spring for the past weeks and now we are seeing signs of the explosion or breakout that usually follows such a descending wedge pattern with its shrinking price fluctuation.
I, like the majority or herd, was looking for still further downward price movement in what looked like a bearish capitulation, and I was waiting before buying in at lower prices. But as usual the herd is generally wrong and when the majority say one thing, the opposite usually happens. What a maverick bitcoin is.
Experts will tell you though that bitcoin will do this predictably whenever CME Futures trading expires, and today was just such a day, but then who of us remembers these dates and details. Well, the astute and insightful bitcoin fanatics do. The signs were there for those who can read them. Bullish divergences were forming in the daily RSI, which was ticking up while price was sliding down, and RSI usually calls it correctly, regardless of price in these cases.
Interestingly price had initially been stopped just short of the crucial 200 day Moving Average, which is a critical point to determine whether we are in the bull or bear phase. At first I wanted to see if if it can indeed break up through the descending wedge as well as the 200 daily EMA, and it didn’t disappoint. The boom time is upon bitcoin bulls today. The first half of this year saw price above this indicator, suggesting a bull market, which I thought would take us all the way to the new ATH beyond $20000. But when we dropped below the 200 D EMA in late September about a month ago, it looked bad because that is a clear sign of the bull run ending and the bear market returning, even if for only a brief while.
Well that “while” has lasted a month, and has just ended – since price continued its spike and pushed above $8900. Stopping just $100 short and retracing was not enough. Close but no cigar, so I didn’t get too excited initially. We needed to actually see a literal crossing of the line first to confirm our hopes. And cross the line we did – in massive style, making a 40% pump within 24 hours. If that is not a parabolic bull market then I don’t know what is. Actual price levels may vary depending on which charts you examine. I’m looking at the BTC/USDT Binance chart, though others may differ fractionally in price levels. Generally the picture is the same though.
Looking at CoinMarketCap we can see that most of the altcoins were also pulled up in unison with bitcoin as usual. This will make everyone very happy, as they see their favorite investments and projects all get a much needed boost. The altcoin market is in a desperate situation as far as price or value is concerned, not that price is a real indicator of value in a cryptocurrency project. Price is often clouded by sentiment, and we should rather look at fundamentals to see the real value of a project, along with actual usable tech or product that solves one or other problem in the finance or larger world.
Most of the altcoins also claimed a 10% gain or thereabouts. Ironically all the stable coins were the only ones to show an actual decline for a moment, and were actually priced at $0.98 during the peak of the first pump, which is a 2% drop, present in USDT, USDC, Paxos, TUSD and even Dai. They have all since stabilized back at their peg to the dollar, but it certainly looked odd for a while as they were the only ones in red while all the rest pumped into the double digits mostly. For a change bitcoin led the charge, and the altcoins tried to keep up as best they could.
I must put in a jibe here at Steem if I may because, despite all the bullish upsurge in most coins – up to 10-20%, Steem only managed a mere 4% at first, and then despite a 20% pump compared to bitcoin’s 40%, has settled at a mere total of 8% climb in price compared to bitcoin’s 28% so far since the retracement, which leaves me wondering if there is any hope for the once great innovative crypto-based social media sight. Others are now overtaking it in numerous ways as its heyday seems to have evaporated like a puff of steam actually. There are others on a much better “uptrend” compared to the sinking steemship. Something about the design and model of steem is just a bit suspect to me. And I’m not alone in seeing this.
Of course in BTC value none except for a few anomalous outliers gained in value as they mostly were unable to keep up with bitcoin’s parabolic upsurge in price today. But let’s remember in conclusion that bitcoin is not making these moves by itself. Today’s pump coincided with a significant event in the investor calendar, namely the expiration of the CME futures trading, and this seems to occur repeatedly, so correlation does indeed imply causation in this particular case. In other words the bitcoin landscape is not what it was and is changing constantly with the arrival of newer investment tools from the mainstream financial world.
And this, in my opinion, in a bad thing for crypto. These “financial tools” or services are actually somewhat morally questionable. And some of them – like futures trading, margin trading, leverage trading – sometimes don’t actually deal in physical bitcoin (there’s an oxymoron for you). Not that bitcoin is physical as it’s digital and beyond physical but you get the idea. No actual bitcoin is traded when dealing in some of these tools. Only price is speculated upon, with profit made if you guess the correct market direction and price. You don’t buy or sell any of the 18 million bitcoin available.
And as a result, these tools or services for speculators or traders actually inflate the hypothetical amount of bitcoin that can be speculated upon or the amount of trading that can go on way beyond the 18 million bitcoin for sale currently (besides those lost of course, or in Satoshi’s wallet). And if you do trade in bitcoin with these tools, the leverage of 100x hugely and artificially inflates the amount of so-called bitcoin used in these trades to way beyond 18 million currently in circulation. It makes it appear as if there are more bitcoin and thus messes with the real scarcity.
These leverage trades on Bitmex and other exchanges are so huge and inflated by 10-100x margin, that they end up swaying the overall price for all of us, when they get liquidated for example. The industry is complex and expert investors can explain it with more detail, but overall there is cause for concern regarding all these fringe or sideline products and channels for trading around bitcoin or about bitcoin price without actually buying or selling actual bitcoin. It skews the trading table for all of us and manipulates the price. That’s how whales control the market if they want to. These financial tools are questionable, though speculators and gamblers are addicted to them, so they will probably always be there. Maybe I’m not experienced enough in the industry to appreciate them, so do your own research and find out how deep the rabbit hole goes.
To listen to the audio version of this article click on the play image.

Brought to you by @tts. If you find it useful please consider upvoting this reply.
Hi @julianhorack!
Your post was upvoted by @steem-ua, new Steem dApp, using UserAuthority for algorithmic post curation!
Your UA account score is currently 2.994 which ranks you at #11311 across all Steem accounts.
Your rank has not changed in the last three days.
In our last Algorithmic Curation Round, consisting of 81 contributions, your post is ranked at #47.
Evaluation of your UA score:
Feel free to join our @steem-ua Discord server
Still dont know whether to sell everything or hold on! I went up and down as I read this post.. as for Steem, most of us here still holding on. I guess the thought of starting again somewhere new is depressing and tbh, i would give it all up entirely.