Technical Analysis 101 - Trading View
Welcome back to my Technical Analysis series, in the last issue I covered exchanges and different types of buy and sell orders and fees. This issue I will be covering the main tool we will be using to try to make that technical analysis, Trading View.
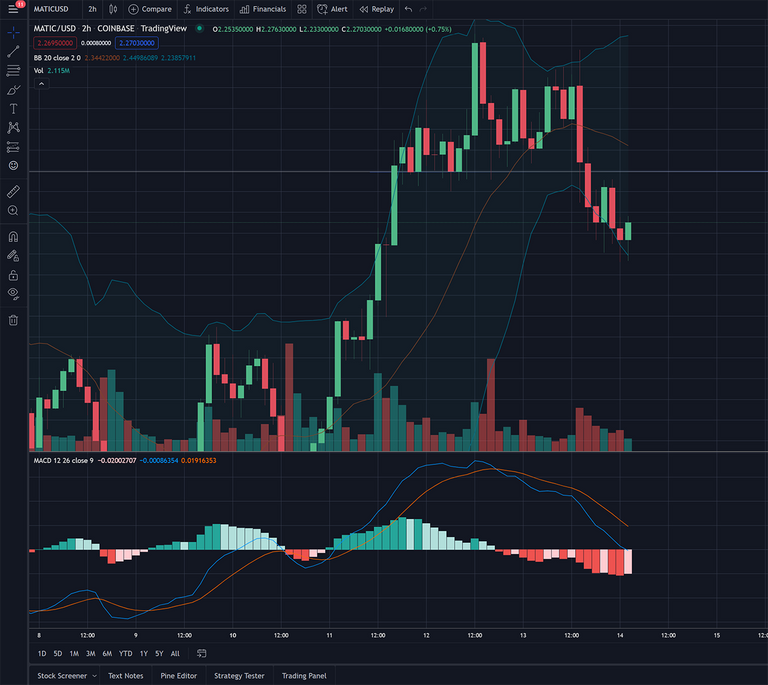
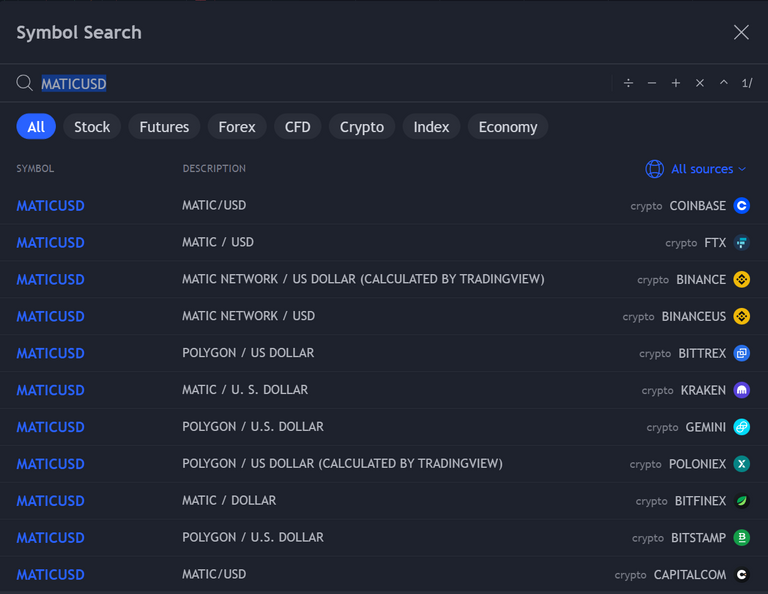
I am not going to cover every option on trading view in this issue, just some of the more commonly used ones. you can see from the information in the above image along the top we are looking at MATIC/USD 2 hour candles from COINBASE. Trading view has historical data or can pull data from most of the major exchanges and even non-crypto exchanges as you can see in the image below.
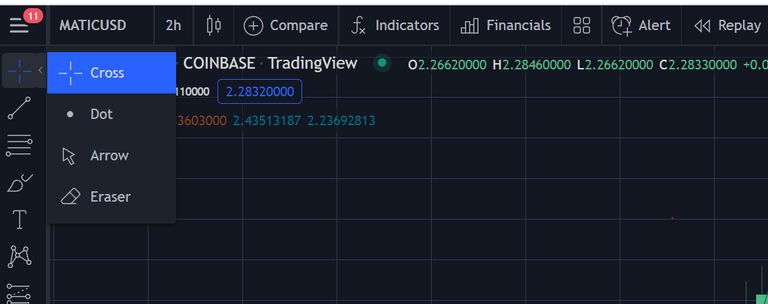
In the top left we have cursor selection, this is all a matter of preference, but there is also an eraser here for erasing things you have drawn.

The second option is a suite of drawing tools. The most commonly used is the trend line which simply allows you to draw a line from point A to point B. Hovering over the trend line in option also tells us to use shift to draw straight lines at angles of 45 degrees. Along the top on the right side we also have options for changing color, width, style and other properties of our trend line. Once the line is placed you can select it to adjust length or position or hit delete to remove it.
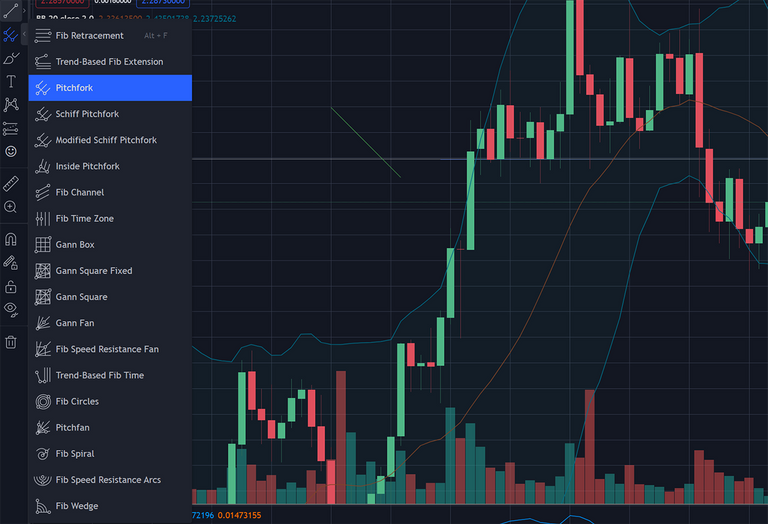
The next set of tools is a little more advanced and will probably get their own issues in the future, starting with Fibonacci. For now though there are three groups of tools in here Pitchfork, Gann and Fibonacci.
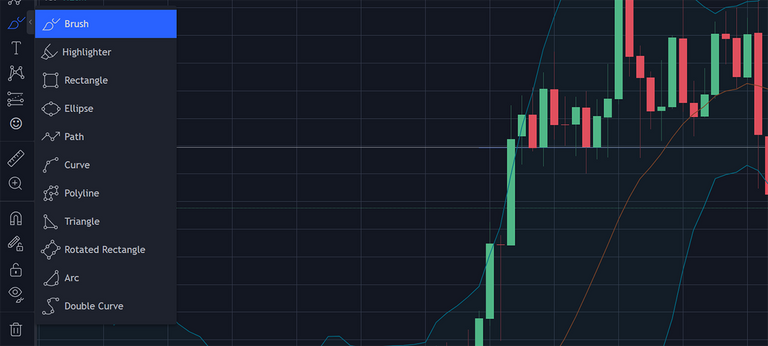
next up we have some drawing and shape tools. The brush allow you to draw on the chart like a brush or pencil. High light draws a wider line much like a highlighter. followed by a variety or tools for making shapes and curves.
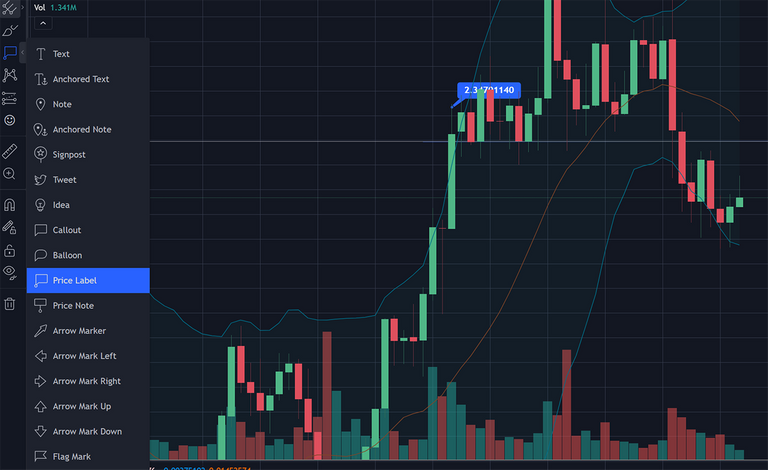
Then we have labels most of the ones in here get more use when publishing your own charts. They allow you to put text labels, notes, arrows and other labels on your chart. One useful one you can see on in use on the image is price label, selecting it and clicking on a spot on your chart will label the price at that position so you don't have to keep looking it up.
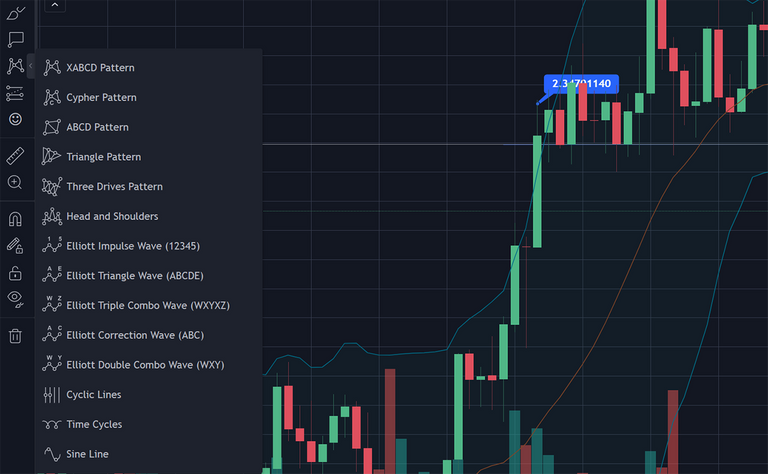
The next one, patterns is another advanced one that we will cover more when we start learning about trading patterns. one of the more popular patterns here is the Elliot wave pattern. Below this we have some prediction tools for helping you mark and adjust your current strategy on the charts and then right below that you have a large selection of icons. The measure tool allows you to drag over an area and view information about the price action in the highlighted area. The magnet tool will cause your drawing to snap to the price action for accuracy. That about covers the basics of the main tool we will be using for technically analysis, next time we will take a look at some candlestick patterns and trends. Don't forget to give a follow so you don't miss future issues.
Take a break and play2earn in Splinterlands with me.


Join the Cartel
0
0
0.000
https://twitter.com/UnlikelySurviv1/status/1481863755424165891
The rewards earned on this comment will go directly to the person sharing the post on Twitter as long as they are registered with @poshtoken. Sign up at https://hiveposh.com.
Congratulations @unlikelysurvivor! You have completed the following achievement on the Hive blockchain and have been rewarded with new badge(s):
Your next target is to reach 20 posts.
You can view your badges on your board and compare yourself to others in the Ranking
If you no longer want to receive notifications, reply to this comment with the word
STOPTo support your work, I also upvoted your post!
Check out the last post from @hivebuzz: