Market Update and Analysis on BTC, NEAR, LUNA and STACKS
Are you a crypto trader or investor? I think you may find this interesting and helpful. Here, we'll be updating ourselves on the price movement of a few crypto assets. The assets in view include; BITCOIN, LUNA, NEAR, and STACKS.
BTC/USDT
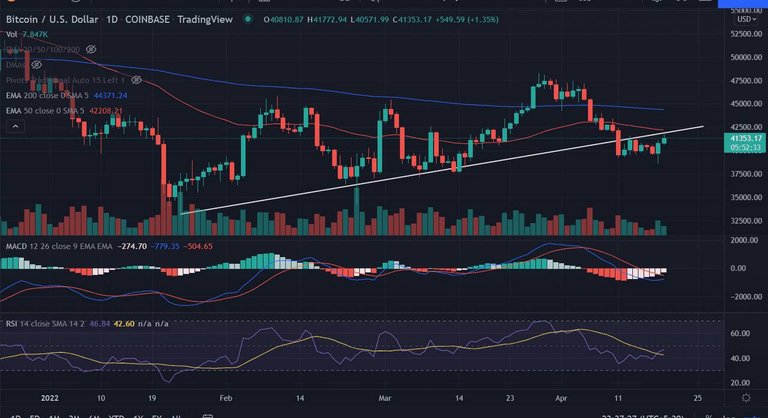
On the daily chart, the ascending trend line, which is extending from the lows of $32,933.33 acts as a support for the bulls. The BTC buyers tested the bullish line twice but failed to hold it for the third time. The price consolidates for a week but bounces back from the critical support at around $38,000.
On the flip side, if the price failed to sustain the session’s low, it would invalidate the bullish outlook for the asset. A spike in the sell order could revisit the $38,000 mark. Or a spike above $42,000 could see BTC hitting $47,000.
On the whole, I'm bullish on BTC.
NEAR/USDT
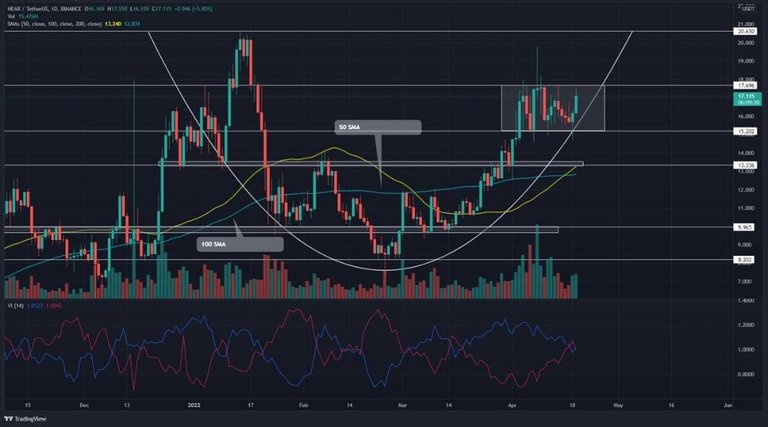
The NEAR/USDT shows a rounding bottom pattern in the daily time frame chart. Under the pattern’s influence, the coin price represented a significant rally in the past few weeks, bringing it to the $17.7 mark.
Amid the recent uncertainty and sell-off in the crypto market, buyers struggle to surpass the overhead resistance of $17.7. However, the buyers did not give much ground and prevented the coin price from falling below $15 support.
The resulting consolidation reflects a narrow range confined between the $17.7 and $15 levels. Furthermore, the recent price jump accompanied a $41% spike in volume activity, teasing a range breakout.
Based on the above premise, NEAR has a key resistance zone of $17.7 - $20.66 while its key support range is $15.2 to $13.3.
LUNA/ USDT
LUNA proves to be a very promising project that cannot be ignored. For long-term buyers, LUNA guarantees a huge return on investment.
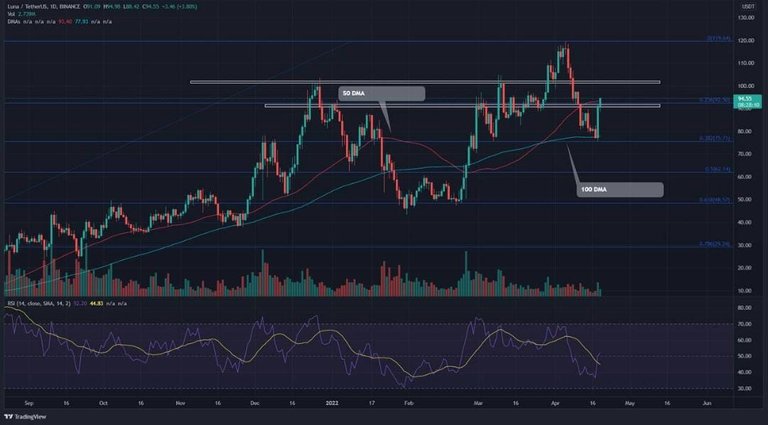
Looking at the chart, a V-top reversal from the $120 all-time high level plunged LUNA price to the $0.328 FIB level. It is clear that the retracement rally broke some significant supports, such as $100 and $90, registering a 36.7% devaluation.
However, a confluence of technical support of 0.328 FIB ($75) and the fundamental perks mentioned above triggered a massive pump of 20% on April 18th. On April 19th, the follow-up bullish candle broke the immediate resistance of $90, initiating a post-correction rally.
On the whole, the $100 mark remains a critical level for LUNA, and it is wise to keep a close eye on the price action near $100.
STX/USDT
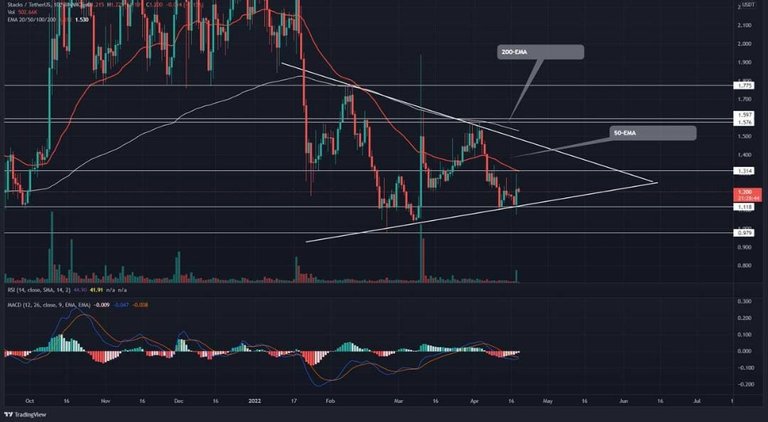
The STX price remains trapped in the symmetrical triangle pattern formed after the remarkable fall of 40% in January 2022. The triangle showcases an equally strong trend line on either side, with the support trend line ready to initiate the bull cycle.
In the recent bear cycle, STACKS price declined 26% in a week before creating a double bottom pattern on the support trend line. However, recently the bulls failed to provide a bullish breakout to this pattern as the previous daily candle shows a long-wick formation reflecting a bullish take-back.
For STX holders: The support trend line and the $1 psychological barrier provide a launchpad for bullish reversals. However, a bullish reversal and the double bottom breakout will reach the resistance trend line or surpass the $1.40 mark. Finally, the bull run will bring a bullish breakout in the best-case scenario, potentially to $1.60.
Was this helpful? Do you have a different theory? I'll be more than glad to hear it.
Remember, this is not a financial advice so, do as you please with the information.
Crypto trading is highly risk. On that note, learn and ensure to manage your risks properly. This will help you last longer in the market by preventing huge and incessant losses.
Posted Using LeoFinance Beta