Crypto Analysis | Hive Chart Looks... Awful
Good day Hiveians!
Join me in analyzing the crypto markets!
No way to sugarcoat it, Hive is in a bad spot right now
But... there are two silverlinings which I will be talking about at the end.
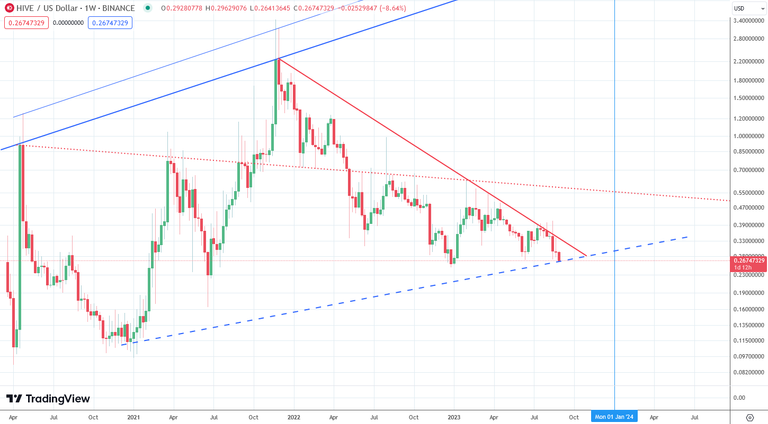
Hive has made a lower low on most exhanges and is continuing to drop like a stone. The big exception is Upbit on which Hive has not made a lower low. I have tried to explain this discrepancy in part by the Mandala exchange rerollout which has added additional selling pressure on the market. But Hive is just barely holding above the previous low and around 15% from the ATL for this cycle. For Binance this is only 7%... it's not something I'd bet on that it will hold. Worse still, the "macro support" does not seem to carry any relevance at all. That's a bit shocking honestly, since we need to hold these levels if we do not want to drop back to the dreaded 10-15 cents levels which are now in reach's grab.
This "support" is not a support at all as we can see now. I have therefore marked it as a dotted line. All previous levels have failed to hold this line afloat, which means that Hive currently does not have a good support. It could fall into the sub 20 cents area easily. Additionally, the red resistance is incredibly strong. While price has broken out of it a couple of times it has just extended the price movement a bit to the right and then kept rejecting attempts to push beyond it. We have a "strong ceiling and a weak floor" one could say I guess.
Hive's pattern has suggested this all along
There is a clear pattern for Hive. A bigger peak and 2 smaller ones. This next chart looks messy, but bear with me. You can see the subwaves in blue as well as the larger one in black as well as the pattern itself on the top right:
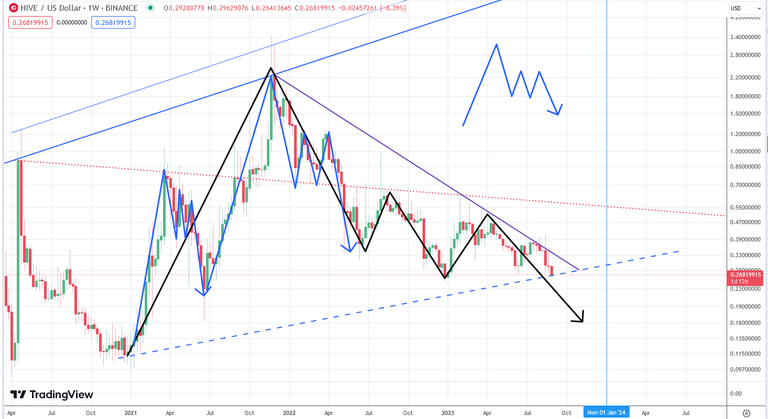
If this pattern once again plays out, we would see HIve's price dip to around 16 cents again. If you look closely we already had 16 cents back in 2021 and it was a bit of an anomaly. It was an extremely harsh correction which might again get revisited soon. Of course the good news is that should this pattern come to an end, we should once again enter a much larger wave upwards.
Silverlinings
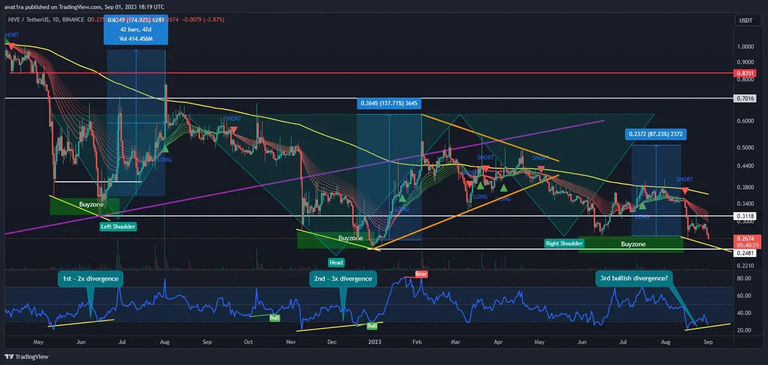
As promised some good news to end the post. @digi-me pointed out that we are seeing a bull divergence atm. Should price not dip much lower it should hold and could lead into an upward momentum taking us back perhaps to the 40+ cents levels.
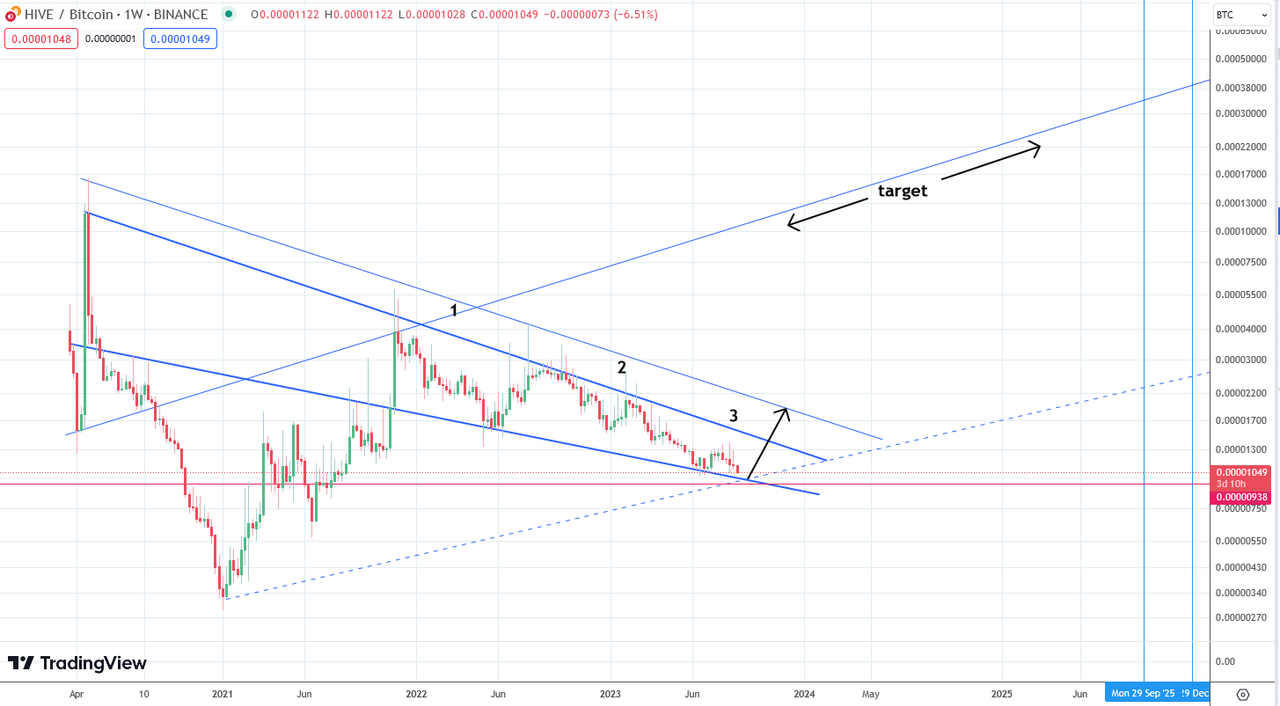
The other thing to note is that the Hive/BTC chart looks as if the pattern could be completed there very soon as well. I spoke about this in my last post and it could lead to a trend reversal:
As a general reminder: Please keep in mind that none of this is official investment advice! Crypto trading entails a great deal of risk; never spend money that you can't afford to lose!


Check out the Love The Clouds Community if you share the love for clouds!
I certainly hope things can turn around soon, things feel very bearish.
We should be close to the bottom then :)
Hive is certainly taking a spanking. If we dip lower, I may need to buy more.
😊
Thanks for the mention. Hope we hold the low, otherwise it also looks like a descending triangle in higher timeframe. Outch, it will bring us guaranteed sub $0.20 as you say, in which case it will probably be the accumulation range for the rest of the year..
From the chart it appears that if Hive breaks the lower level then Hive price may drop further which would be really sad.
I think the market is over bearish, alts will do as BTC does, if BTC can range from $24k to $28 during septempber and not loose $24k I dont think we going to see $Hive at $0.16, good times to dca imo

@tipu curate
Upvoted 👌 (Mana: 59/69) Liquid rewards.
Actually, my problem with Hive is not technical. Based on the technical analysis, it's completed the 5 wave correction pattern, so it could turn back anytime. 2 main problems: 1., fundamentally, i don't see any reason for that 2., the BTC price, chart, technical analysis.
Even if BTC won't break down the previous low, there is a very good chance, it will repeat the 2019-20 move in the coming half+ year. Slow decline back to at least 20k (to complete the same pattern what you show in Hive case, it should go below 15-16k).
So my only question, why do you suppose Hive won't follow that? Even take further more bigger hits. Fundamentally, there is not even potential reason for turning.
And for sure, it could be a good entry price, however, these catching the bottom things rarely work out, should see a bottom forming first. And not even in Hive, but in BTC. without that, who knows where Hive will turn? at current price, 20c or 15 maybe even lower?
Anyway, BTC 88.6 Fib retracement is at 11k. Even if we look at the 2019 little spike and 2019-20 correction back (that's turned at 88.6 Fib), and suppose it will repeat, it should still fall back way under 20k, around 17.5k (where is the big 78.6 Fib retracement anyway).
so for Hive, not the actual price, tech an. or anything else will indicate a good buy opportunity for me, but mostly BTC chart.
didnt mention USD index, gold, silver yet. that has something to do with it, too.
the only one, i 100% agree the HIVE/BTC chart, that can really turn anytime. it doesnt mean Hive won't further decline vs usd.
of course, the timing. if things will play out similarly like in last circle, there is min. half year more correction.
hi, thanks for the long reply!
I have a couple of arguments I can give you.
My idea so far is that winter 2022 was the end of the bear market. I am defining bear market as making lower lows. Since then the market in general has not made lower lows. From previous cycles that timing also fits very well; we always had around 1 year where BTC made lower lows and then reversed. This cycle is for sure going to be even less volatile thean the previous ones, so we can expect price to somewhat gradually head up higher. We could head back to ~22k, but there is a strong support there so I don't think BTC will go lower. That's an idea to be tested ofc.
As for Hive; the biggest reason for not making lower lows I can give you is the fib retracement level of 0.236 which Hive almost always obeys.
The pattern in this post I mentioned could also be completed by heading into the 20-24 cents area. The caveat is that we do not have any macro support currently, but there is support in terms of horizontal lines we can draw in the 20-25 cents area.
I thougt for a while, too, 2022 was the end. Since couple of months, I see it differently. You just draw Fib retracement in the opposite way. Not like it is important in Hive.
However, it is important in BTC. I talked about BTC when mentioned the Fib levels. It's started very nice from 2022 dec, however couple of months ago, it started to look like more correction and another drop, instead of the beginning of the long term up move. (with the small higher highs, and long corrections). Today, it is clear, it's broken down the support line of 2022 dec-2023 jun ( i didnt draw).
I really liked it turned around the 78.6 Fib level, but how it looks today, it can easily fall back there, or even lower (personally i think, that's more likely), especially, if I look at the last 3 weeks weekly candle... next month will clarify that.
Other thing, the BTC CME chart:
There is a huge gap between the 2 weekly green candles in Jan 2023. Not always, but most of the time, the traditional markets fullfill these gaps, before doing any kind of big moves in any direction. That project to fall back at least 20k.
And again, in this BTC scenario, not important how Hive chart looks like. There is no fundamental reason why not follow further BTC moves, with bigger hits, as usual. That naturally means new lower low, completed 5 wave correction. Most of the cryptos are heading in that direction.
Top of that, if you draw the Fib ret. from dec 2022 - jun 2023, the 88.6 retracement, pretty much in the same zone, where the big one's 78.6, around 17.5-18k.
The USD index also suggest that, as it makes a nice upwave, if that breaks down, things maybe can change in crypto, but i don't see that's coming anytime soon.
Next week can decide it for the next couple of months, as BTC looks like breaking down, USD index looks like breaking up a support/resistance. if that happens, nothing around for a while, what can change the direction. in this case Hive easily will hit or go under 20c. (obviously, all alt-coins will be hit bad, not only Hive)
how i see the things.
T fib channel works quite well from my expeirnece and I can show you a dozen examples where 0.236 is important. The fib retracement also has it's usecases, but cannot show a bottom.
The HIVE/BTC chart suggests a bottom only a couple of % points down. In fact, Hive almost always pumps in a red market, especially for BTC. Yet it does follow the larger trend ofc.
There is an absolutely massive support at 22-23k from back 2019, it's a big gamble to think that it won't hold imo
the DXY correlation is strong, but one can easily make the case for it going down with the Brics+ announcement.
Good discussion :)
yeah, good to speak with people who see it differently.
I meant, if you suppose a further bull run, you put the 1.0 Fib to the previous bull run's low, and the 0.0 to the previous bull run's high. you draw it in the opposite way.
My personal experience is: the support/resistance lines rarely works. more correctly, you can draw so many, that some of those will work, but how to pick which one... so I don't give much attention for those.
Fib levels and generally, the wave theory is ok (when some pattern near to end, then i look some support/resistance lines), and at least in wave theory, there are much less patterns, confusion. Basically, the only question for me, it is a 5 wave correction down from BTC ath or was a 3 wave, and it is over. Even if it was 3 wave, I am confident about minimum short-term down, as from Dec 2022- Jun 2023 it is a smaller 5 wave upwards pattern, so obviously minimum a 3 wave correctional, downwards pattern should follow. (not always, but most of the time)
we will see, actually, i get out most of cryptos 2 months ago (what i just bought for catching the next bull run). 50% is 50%, and actually i could see a 50% more down in BTC (obviously in other cryptos it is much more). anyway, that's not the really important thing. i don't see any proof, Dec 2022 was the low, nor any kind of good correction, correctional pattern nowadays, what should indicate further upmove in the coming months. so i stuck with my 'we are atm in the 5th and last wave down', unless i won't see any fund., tech. reason what confirms the opposite.
have a nice day!
This would be a completely normal thing for an altcoin to do in a pre-halving year.
I guess so...