Crypto Analysis | Hive Chart looks... Awesome?
Good day Hiveians!
Join me in analyzing the crypto markets!
Is this the long awaited trend change?
Just last week I tried to convince you how awful the chart looked, so why do I have a different impression now? Well, for starters it's a click bait title ;) But on the other hand, we are in for at least a "relief rally" it seems. It's too soon to say if this will also be the start of a macro reversal. For that several things need to happen. But let's first look at the daily chart:
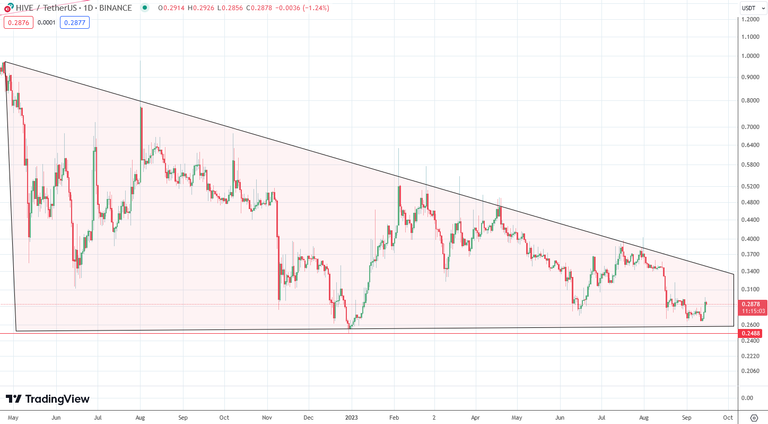
For more than a year price has been in a downward trend. The good news about that is that all downtrends turn to uptrends after a while... the question is just if they will still happen in the larger downtrend. We can see at least 3 subwaves with smaller peaks as well. If price should break out of this pattern we could speak of a macro trend reversal.
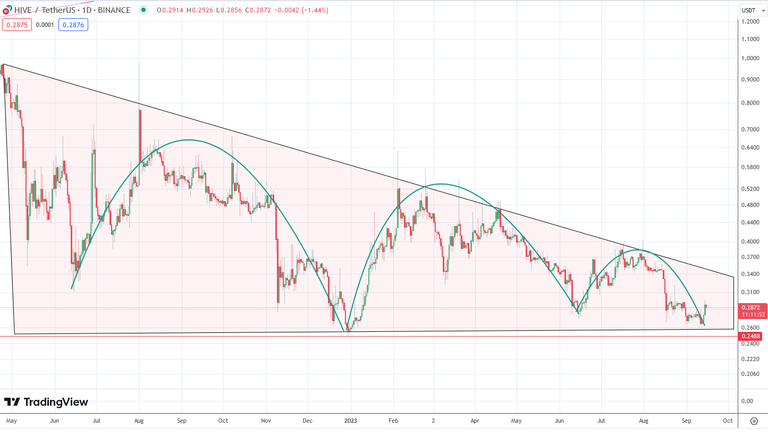
Notice how the waves are always getting smaller, but have the same pattern. An anomaly so to speak is the lower low of the last wave and I have speculated this was because of the Mandala exchange rerollout. On Upbit, e.g. price did not make a lower low.
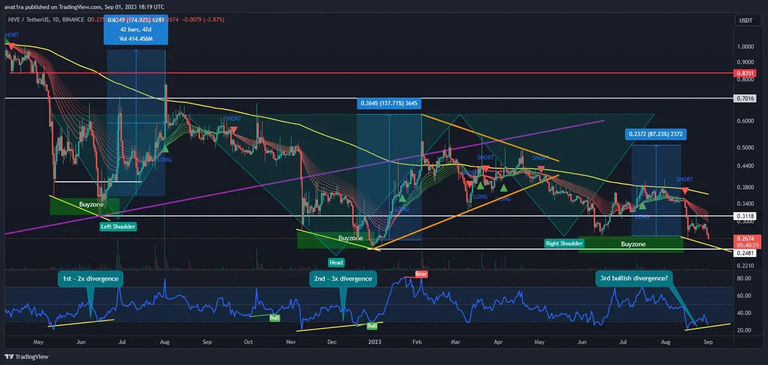
I'll post this chart from @digi-me again since it seems to be playing out exactly like he predicted: Everytime the RSI diverged from the price (i.e. it went higher while price went lower) we had a "relief rally". In the first wave this led to almost 2x gains, then 1x and 0.5x. So... that would mean the next rally would be around 0.25x or a lot bigger. It's unlikely that these waves just keep getting smaller. At one time they break out of this pattern and start a larger one again.
If so, we could expect price to rise continually - normally Hive makes a higher high every day for a week or two before price crashes again. But, as I said this time I fell could be different since we are about to encounter the macro resistance going all the way back to the ATH at around $3.4. Price generally "explodes" when it breaks such a resistance. There are two obvious ones (here marked in red):
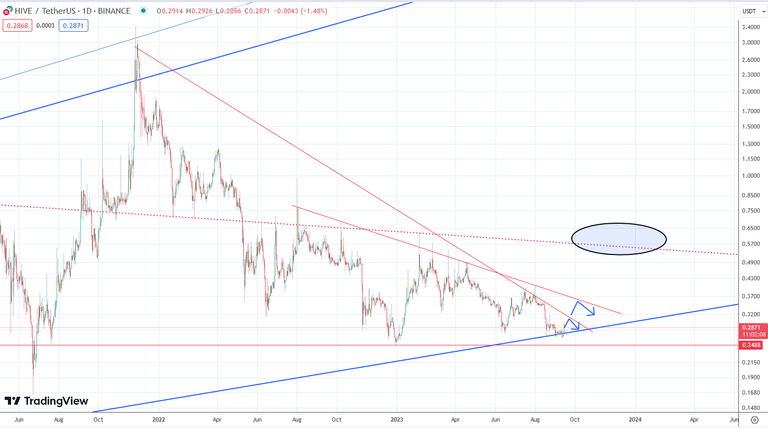
The first one is at around 32 cents, the next one at around 37 cents. If price manages to overcome them, things are going to start looking interesting. This is because there wouldn't be an obvious resistance until about the 50-60 cents range. And critically, if we go above the last subwave at around 40 cents it would confirm imo a macro upward trend.
Conclusion
I am pretty confident that if price goes above 40 cents (as a candle) it would mean that we would be starting a macro trend reversal. This impulse wave would at least go back to the 50-60 cents range, but probably higher. But there are still many resistances; so let's first wait and see...
As a general reminder: Please keep in mind that none of this is official investment advice! Crypto trading entails a great deal of risk; never spend money that you can't afford to lose!


Check out the Love The Clouds Community if you share the love for clouds!
knowledge post, Market is all about up and down, yes you are correct all down trends are now to ends, it time for booming... thanks for sharing..
Macro trend reversal? Haven't heard of that before.
Well with macro I mean the time scale ;)
Okay👌
Thanks for the mention @tobetada. It looks great, as you say we need to clear 0.37, if we do we should se 50-60 cents fast I think :) if not its looking like a big decending triangle ouch..
Hmm yeah let's hope for the best!
yeah definitely 😊
Are you paying to use Trading view?
It can do one more hard drop before it spikes so that we can all stack up on some of those Hive!
!BEER
View or trade
BEER.Hey @tobetada, here is a little bit of
BEERfrom @technicalside for you. Enjoy it!Did you know that <a href='https://dcity.io/cityyou can use BEER at dCity game to buy cards to rule the world.