Crypto Analysis | Hive at Threshold - Another Pump Incoming?

Good day Hiveians!
Join me in analyzing the crypto markets!
I have been closely following Hive's price action recently
And it looks like to me that Hive could make another big move very soon (probably within the next week). After the three latest pumps it seems to me that another one is about to happen. But let's first look at what we said in the last post.
I gave an outlook there for price and we saw the 1 mil. buy wall which has now disappered on Binance. No surprise there as it is very uncommon for such big orders to stay on the market.
The current depth chart looks like this:

As we can see it looks much more even compared to last month as there are only slightly more selling orders than buying orders. There is also a fairly big support at current levels with about $50k buying orders. This is very visible in the chart with the buying orders having a steep drop off.
I also gave this outlook:
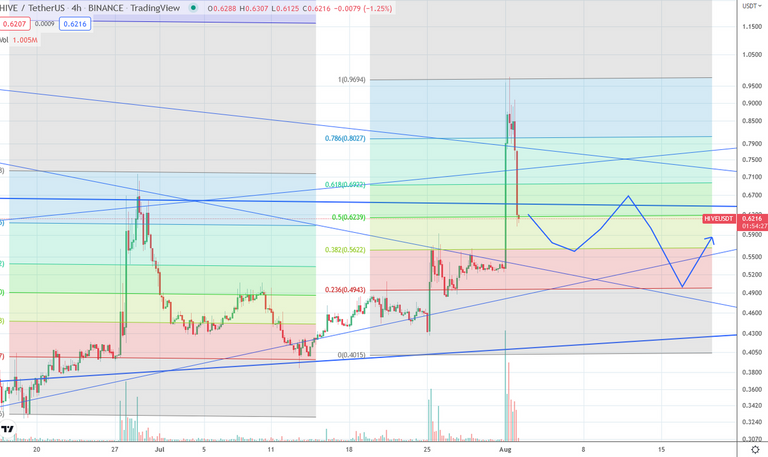
Which has so far been very accurate: we saw the price decline to exactly 55 cents and then a recovery to about 64 cents. But I want to make a modification. Just like in the last pump when I noticed that the last correction of the fractal didn't seem to be occurring (i.e. a gradual increase in price) this seems to be happening once again, suggesting that we might not see the final correction to about 50-53 cents.
Here is the chart again:

In fact, the last pump could be the modified fractal for the current potential pump. We could therefore see the last part of the fractal being the start of the new one, or the "classical" completion with a final red arrow down.

Notice that there have now been 14 days since the last pump. And as noted in a previous post there are about 16 days between big price movements. This means that we are about "due" for another movement.
Hive is at a threshold
The bigger picture has a very clear message. We see price now converging onto two major resistances. In the weekly chart we can see the major resistance of the former highs converging onto current levels as well as the horizontal divide.

Price has also established a parallel channel just as in previous upward movements (the finer trend lines). All of this suggests to me that price will continue to go up and probably remain in this smaller channel for at least a month or so.
As already outlined in previous posts, I then see a top of about $1.6 and a decline to about 60 cents before we truly enter the bull market.

As a general reminder: Please keep in mind that none of this is official investment advice! Crypto trading entails a great deal of risk; never spend money that you can't afford to lose!


Check out the Love The Clouds Community if you share the love for clouds!
That's great if another Hive pump coming. I think if I have more Hive in my portfolio, then sell when it's risen !
I would be glad to see it dropping around $0.3 so that I may bag some more.
Posted Using LeoFinance Beta
I think we won't see sub 50 cents anymore actually!
Based on the pattern of the chart, there is indeed a high chance for an upcoming bull market in the near future. We will see.
I think the main bull run will be in 2023/24