Crypto Analysis | ETH Fractal Confirmed and Outlook
Good day Hiveians!
Join me in analyzing the crypto markets!
A month ago I made a prediction regarding ETH which has matched the price movement
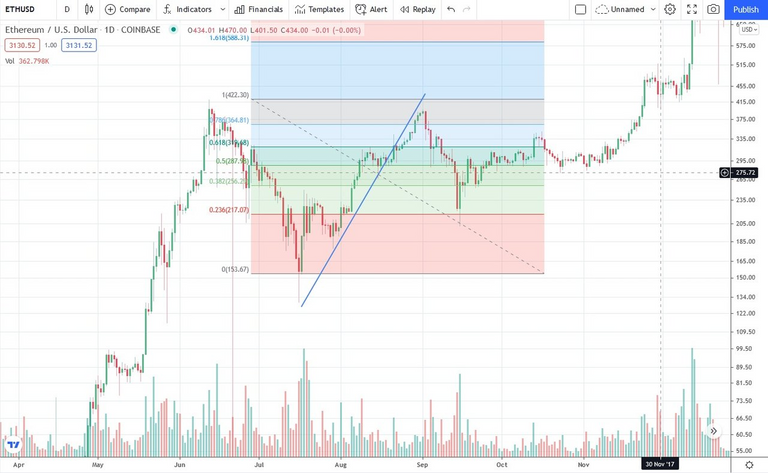
The basis for this prediction was the market of 2017. In this method we simply compare current market movements to the time frame of the last cycle. It's that simple, yet the results can be incredibly accurate.
This is the blueprint so to speak for our predictions. One has to study it in all its details: trend lines, fib ratios, time frames, characteristics etc.
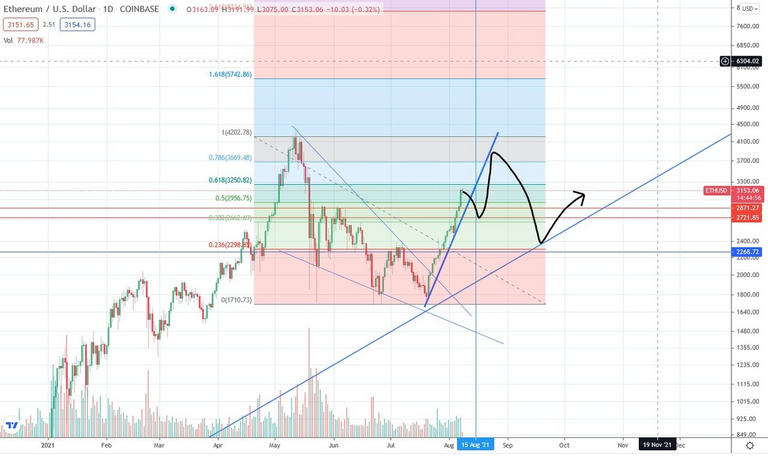
This led to a prediction made on August 8th:
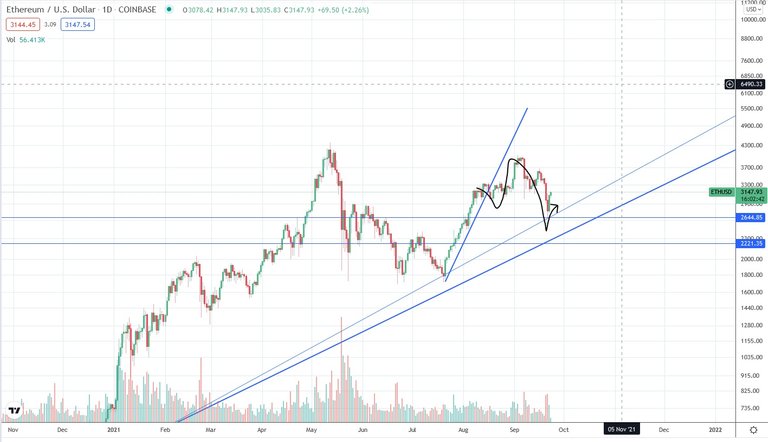
What happened?
If we compare the fractal that I drew in (note that I redrew it as best as I could) we can see that it matches very well with the price action we saw. First note that the height given of 3.7k which was precisely matched as well as the correction to 2.4k which was almost matched (currently at 2.6k). Secondly, the whole pattern matches as well. We had a strong impulse wave to 3.7k and a strong decline to 2.6k and a rebound. The only thing that is different and was somewhat special in this run up was the lag that we saw. Notice that there was a long sideways movement which I didn't anticipate and a run up that didn't go up to the trend line. This was simply not possible because it would have been higher than the peak in May which was not in our blueprint from 2017.
What can we expect from here on?
Looking back at 2017 we can see that after this crash ETH had a prolonged sideways movement until the ramp up in the last phase of the bull cycle.
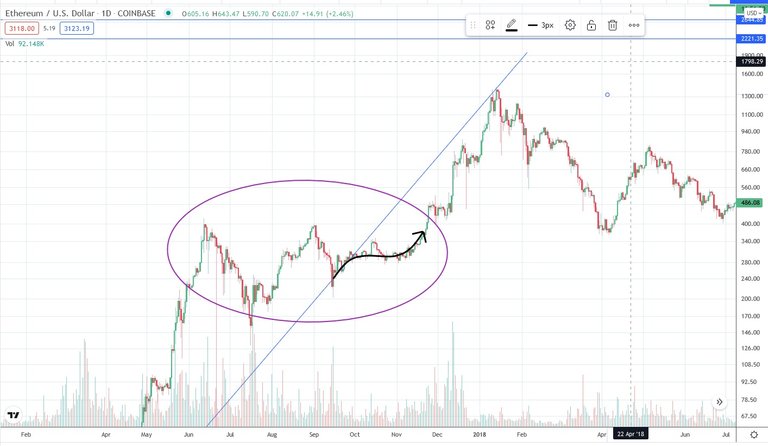
This would roughly translate to a movement such as this:
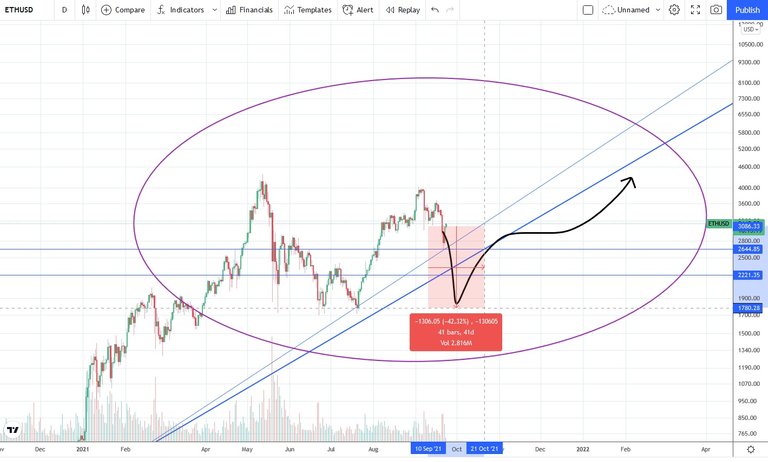
There is another drop that I would expect of about 30-40%: the former support of the macro trend line would turn to a resistance and prices would move sideways for several months. At the end of this year prices should move up again.
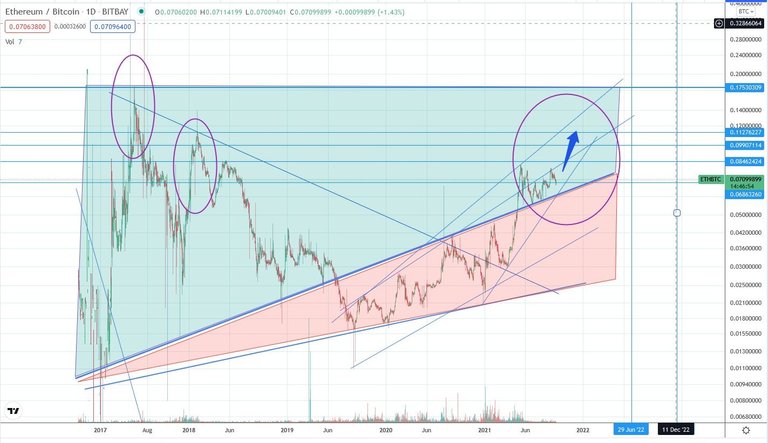
Also notice that the ETH/BTC chart suggests that ETH will still climb up substantially. The unimodal fractal makes it clear that we didn't have a top yet. I can easily see an increase to 0.14 and beyond.
As a general reminder: Please keep in mind that none of this is official investment advice! Crypto trading entails a great deal of risk; never spend money that you can't afford to lose!


Check out the Love The Clouds Community if you share the love for clouds!
I must say you are quite good at analysing cryptocurrencies it's been a while since I have checked the market because I had some really bad shorts and now I am taking a break for a while but yes looking at your post I think you are quite correct on
I'm not an expert of charge but your explanation is quite convincing
thanks :))
Thank you @tobetada, we just have to keep optimistic along with your analytical help. I actually understand some of your explanation being a bit of a klutz understanding the ups and downs of shares.
the best strategy is to think long term. I just have to remind myself that as well at times 😅