Crypto Analysis | Bitcoin Update - Pre/post halving Period + Climax
Good day Hiveians!
Join me in analyzing the crypto markets!
My last update on Bitcoin has been 2 months ago!
Can't believe it's been this long, and the actual post giving a future outlook is even older. After 4 months it's time to look back and see if I talked any sense. Back then I gave a target of 35k-48k after which I thought it likely to see a bigger correction before entering the real bull run. Here is the chart:

And here is the updated one:
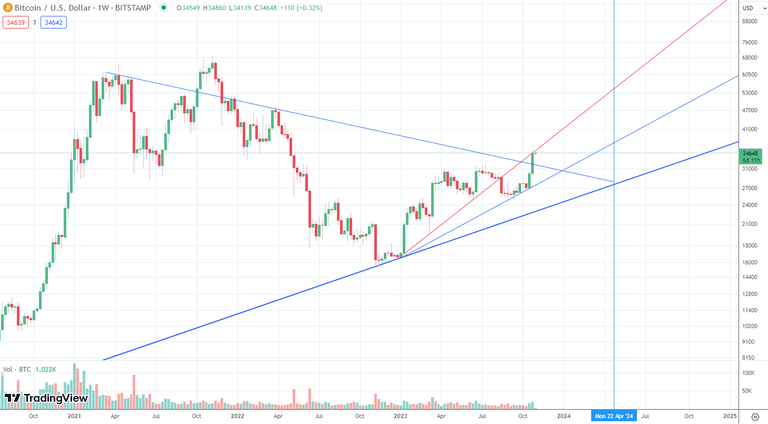
So what's the verdict?
Like always it's mixed: while I correctly anticipated a continuation of the upward trend, the time scale is quite a bit off. Price did not continue straight up as I outlined, but instead dragged on horizontally until recently when price spiked back up. It passed the weaker resistance from the previous highs (now blue line), but is stuck at the previous supporting trend line (now turned into a red resistance as well). With price now at around 35k, we first have to ask ourselves: was that it? Will price head back lower now?
I think we have to answer that with a clear "no". The pattern would look quite strange if price would just fall back like that. The strong price action in the previous weeks indicates a continuation of that trend for the foreseeable future.
What kind of an uptrend are we talking about?
Looking at the past 2 cycles (pre/post halving) we get 2 different kind of uptrend patterns:
- price action within a channel (2015-2017)
- big wave "pump and dump"(2019-2020)
Here you can see them outlined:
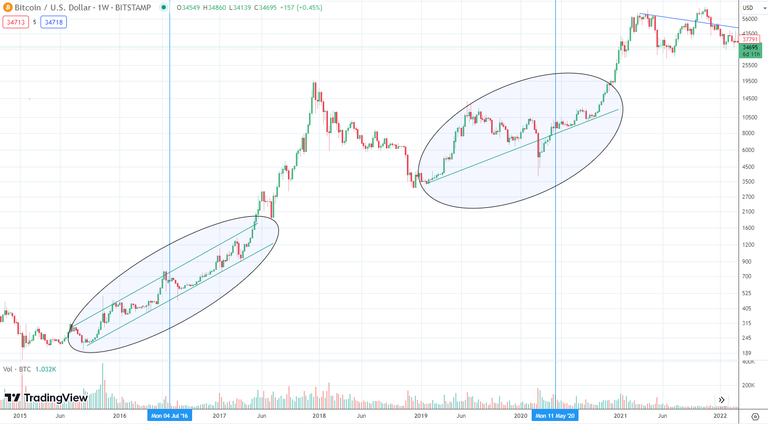
I would argue that the second pattern was an anomaly die to the pandemic in 2020. Price would have never dumped this much (back to 3k) if it hadn't been due to the pandemic black swan event. Yet it is more difficult to draw a channel for that time period even without that drop. Nevertheless, the current price action looks quite similar to what we saw in the first highlighted time frame "price action within a channel".
Here is what I am seeing for the next 2 years:
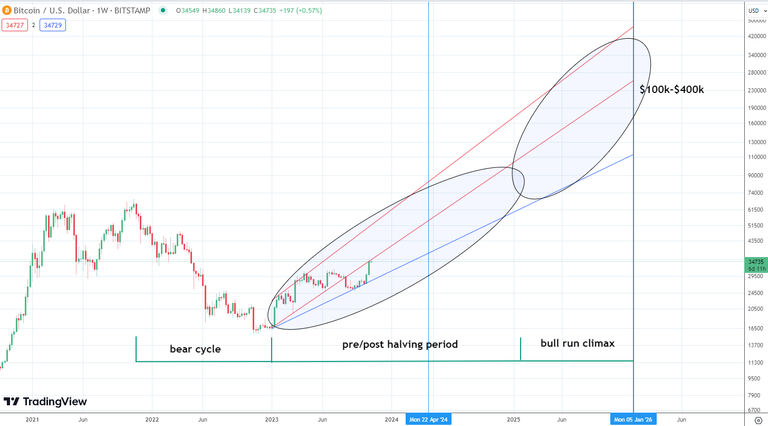
If we assume that bitcoin will continue in a "channel like movement" I think this price action could stay within a fairly narrow range taking the price continually higher. The range itself is still rather large. But I find it very difficult to give a remotely precise forecast for that. The best I can do is give a range in which that movement will most likely occur. This phase could last until all of 2024. After that the "bull run climax" could start to unfold taking price higher for a short period (perhaps a year). Much is pointing towards a 2025 climax and I see a range between $100k and $400k. Of course I hope to minimize that outlook quite a bit in the next year or two. For now we have to confirm that BTC will stay within this ascending channel.
As a general reminder: Please keep in mind that none of this is official investment advice! Crypto trading entails a great deal of risk; never spend money that you can't afford to lose!


Check out the Love The Clouds Community if you share the love for clouds!
Things certainly look very bullish. Where the climax will be, could be pretty epic.
Just like that the time was near and the market was supposed to go up but people were not believing at all due to which they had to suffer huge losses.