Monitoring Performance Metrics on your witness nodes
A couple of days ago I shared how I use Uptime Kuma monitor my witness nodes for up/down events. You can check that out here.
Today I am going to talk about how I monitor my servers metrics (like disk, cpu, and other data) to prevent failures. The best thing, it is completely free to use!
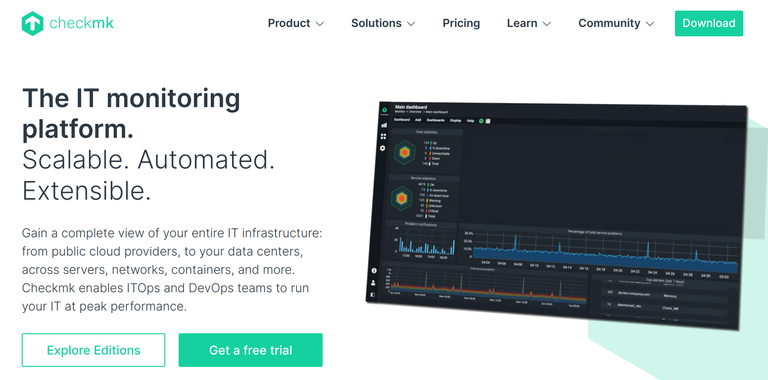
CheckMK is a fork of Nagios, a very popular monitoring system. While CheckMK is a commercial product, the free edition is very generous and allows all the Enterprise features for up to around 25 servers.
CheckMK is a bit overwhelming at first, but once you understand the basics it is very easy to use and setup. I recommend using the Docker install for the Enterprise version.
Once you get the server installed, you need to install agents on each host you want to monitor. You can use the default agent, or you can bake an agent to allow you to auto update your agent and provide some customization. I bake my agent, but purely to enable auto updates.
I recommend just installing the vanilla agent initially, then once you get that working setup encryption and bake your own agent with regular update checks.
Once you install the agent, you will see around 30 metrics show up for your server. If you are running databases or specific applications you may see more metrics.
Here is what one of my witness nodes looks like:

CheckMK can proactively notify you when it sees a problem, or even a problem waiting to happen. Because CheckMK is an Enterprise class product, you can monitor just about anything you can think of.
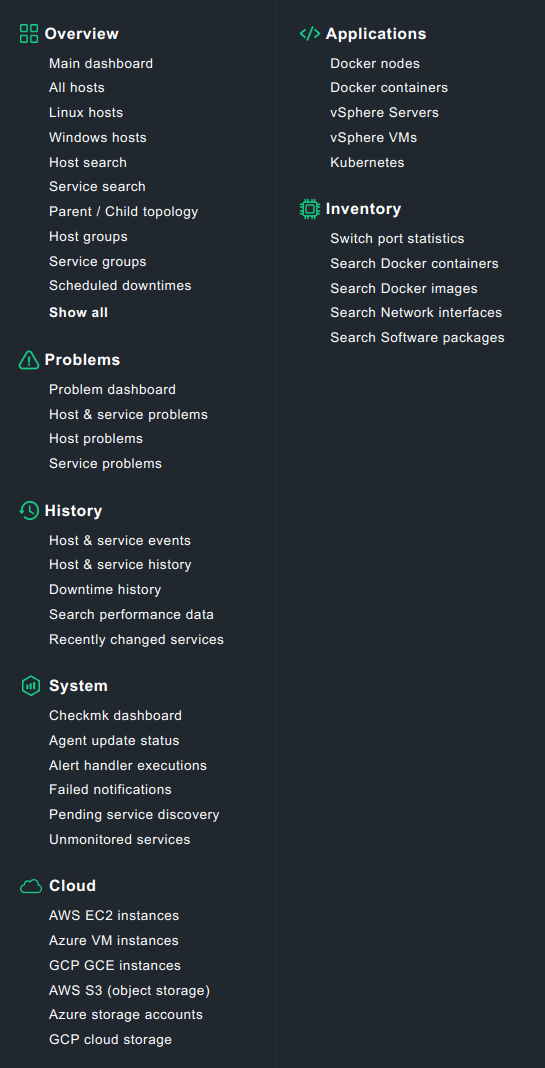
Here I have an overview of my witness nodes.

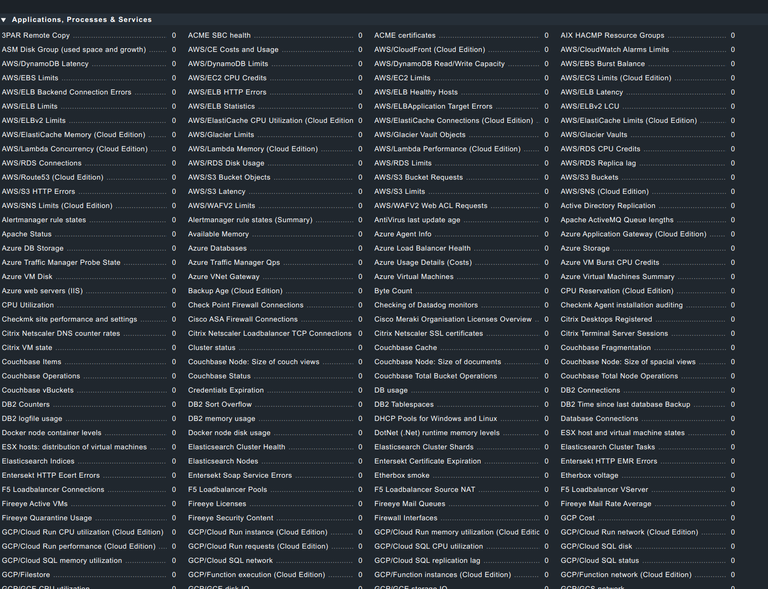
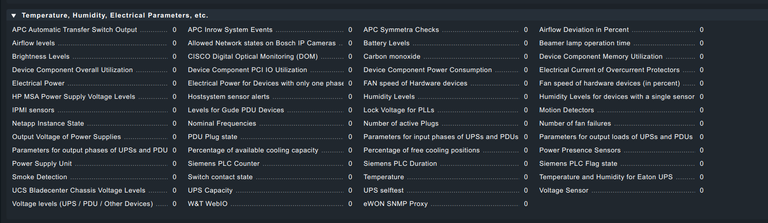
While the base rule set does a good job of notifying you of problems, you can create your own custom rules. As you can see here there are zillions of things you can monitor and alert on.
As with Uptime Kuma, I recommend running this on a dedicated machine outside of your network. You can run it on a VPS along with Uptime Kuma as your monitoring server which is what I do myself.
Into Kubernetes or Docker? No problem, you can monitor that as well.

CheckMK can get as complicated as you make it, but I recommend going through their tutorial videos to understand how to set it up. I recommend using both Uptime Kuma & CheckMK, or something similar that provides both up/down monitoring as well as performance metrics. For extra credit, you can tie all this into log monitoring service like Grafana Loki.
There are a lot of options in this space, but few offer as much power, flexibility, and scalability as CheckMK while still being free to use. If you need more than 25 servers, you can still use the community free edition, but you will lose some useful functionality.
The dashboard looks really nice, better than my nagios one, I had a look at the docs and saw they have a good migration guide to go from nagios to checkmk. Might be worth testing it out.
Are you using the log aggregation with grafana? I do this with a script that pulls logs every 15mins using scp and does a conversation to html, then just view the web page.
Yes