These Excel Tricks Make Ordinary Users Look Like Data Wizards
Data Analysis and Visualization Hacks in Excel
Let's explore 2 amazing data analysis and visualization hacks in Excel. Quick Analysis and Ideas.
Very often when working with data, you will receive an Excel workbook and have no idea what the data is about. Or, what stories are hidden within it. To perform a detailed analysis, you must first get your head around the data. This is often done by visual exploratory analysis. Exploring the data will reveal quick insights and spot trends and correlations. These can be analyzed further if need be.
When it comes to data analysis, Excel has progressed in leaps and bounds over the last few years. Features like Quick analysis and Ideas are making it easy for anyone to explore data, reveal insights and visualize the results in charts and tables. Quick analysis has been around since 2013 and most of us would be familiar with it. But, Ideas is new to Office 365 and can make an Excel user look like a data wiz in no time.
Data Analysis and Visualisations Hack in Excel with Quick Analysis
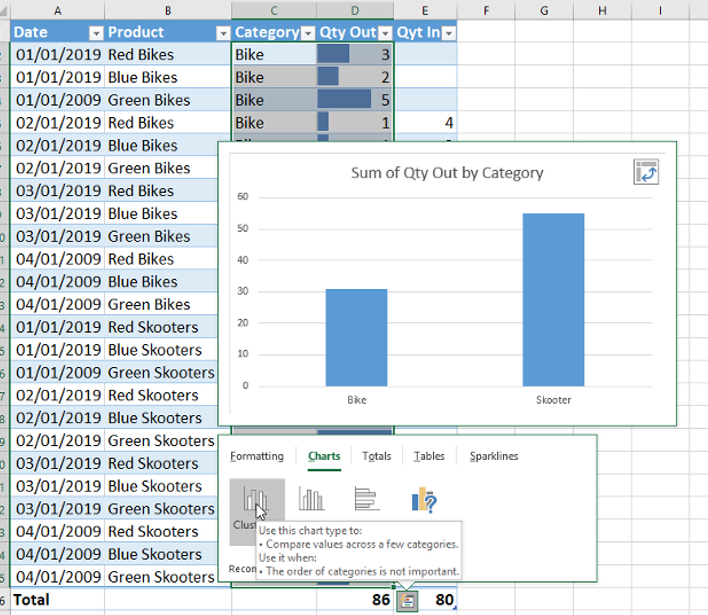
Microsoft keeps adding new features to Excel allowing us to carry out tasks more efficiently. In 2013 Quick analysis was introduced. It becomes available when you highlight some data in a workbook. Quick analysis gives you access to format, chart, totals, and sparklines all within the click of a mouse. I previously wrote about Quick analysis here in a different Excel hacks post.
From Quick analysis, you can quickly do any of the following
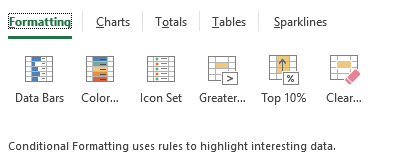
- Add or remove conditional formatting
- Insert or remove charts
- Carry out aggregation functions such as sum, average and running totals
- Convert to a table or pivot table
- Add or remove sparklines
How do I access the quick analysis option?
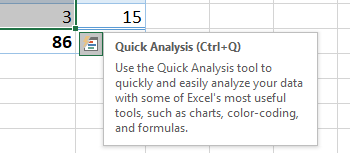
To access quick analysis first select the data you wish to analyze. Then press CTRL+Q to open the quick analysis toolbox. You can also access the quick analysis toolbox by hovering the mouse over the bottom right of the last selected cell.
How do I add data bars using quick analysis?
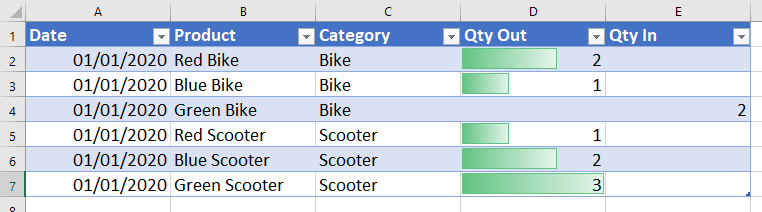
First, select the data you wish to visualize using data bars. the next step is the then to press CTRL+Q. Under formatting select data bars. Immediately the data bars will be shown in your data set. To remove these data bars press CTRL+Q and under formatting select Clear
How do I add a running total column?
Totals are separated into row totals and column totals. To add a running total column to your data, first select the column that you wish to tot. press CTRL+Q and select totals. Scroll over to find the Column running total and select it. A new column will be added to your data that contains a running total for the original selected column.
How do I insert a chart using quick analysis?
Charts can be quickly added to your data using Quick analysis. First, select the data you wish to chart. And then press CTRL+Q and select charts. Excel will show you the most appropriate charts for your selected data. By hovering over one you will get a preview. Click on the chart type and a chart will appear in a new worksheet.
How do I insert a pivot table from Quick analysis?
You can quickly add Pivot tables to your data using Quick Analysis. First, select the data you wish to pivot, then press CTRL+Q and select tables. Excel will show you the most appropriate tables and pivot tables for your selected data. By hovering over one you will get a preview. Click on the pivot table type and a pivot table will appear in a new worksheet.
Data Analysis and Visualisations in Excel with Ideas
Ideas in Excel allows AI to automatically identify patterns, trends, outliers and correlations in your data. It then presents this information to you using charts. It is like Quick analysis on steroids. If you are interested in data analysis and you are looking for a quick way to explore the data, this is an amazing option.
Ideas in Excel are only available in Office 365. It’s a relatively new feature and it is not available in the standalone versions. (Excel 19 and earlier)
How do I use Ideas?
To use Ideas, you must have a connection to the internet. The recommendation is that you present your data in table format. The keyboard shortcut Ctrl + T will convert your dataset to a table.
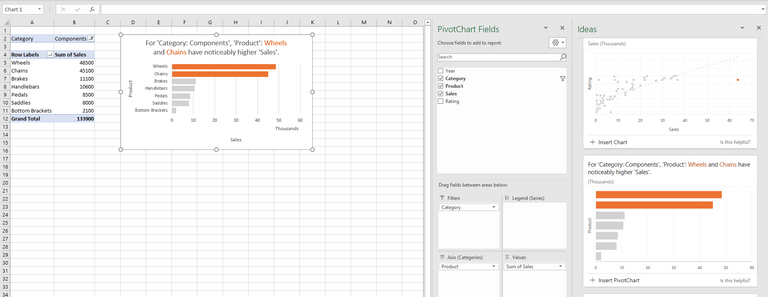
By selecting Ideas from the Home Ribbon, Excel will search through your data and open a new pane on the right of your screen. This pane will show a preview of all the insights available. then, once you select an insight, Excel will insert a formatted pivot table into a worksheet in just one click.
If you select Ideas in an empty workbook, Excel will recognize there is no data and you will get the option to insert some demo data. This is a great way to start exploring Ideas and see what it can do for you.
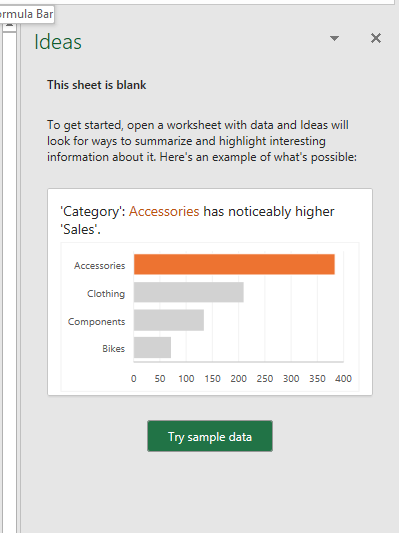
Selecting Try sample data will insert a table of data into your worksheet. And it will present the insights found.
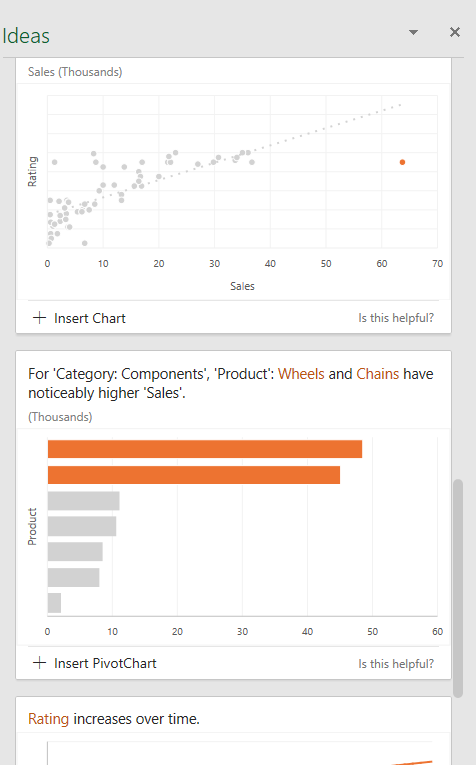
You can use the scroll to go down through all the insights available. By selecting Insert Chart/PivotChart, a new worksheet will open containing the chart and the pivot table. This is a massive time saver. You no longer need to spend ages figuring out how to pivot data. Or what columns should be pivoted against what, as the insights will do it for you.
Excel Ideas put business intelligence into the hands of the ordinary Excel user. And it also puts Quick analysis to shame. No longer does one need to know complex modeling or even pivot tables to get an idea of the story held within the data.
New to Excel? Check out our Ultimate beginner Excel Guide here.
New to Excel Power Tools? Check out these amazing Power Pivot, Power Query and Power view demonstrations
New to DAX for Power Pivot and Power BI? Let us help you get started
Sign up for my newsletter – Don’t worry, I won’t spam. Just useful Excel and Power BI tips and tricks to your inbox with Earn and Learn activities.

Now there is value in Learning with The Excel Club and our Learn and Earn STEEM activities.
We are the first Excel, PowerBI and DAX blog in the world where you can Earn while you Learn.
To Find out more now and start earning while you are learning Excel and Power BI
Enjoyed these Excel Hacks? Before you leave, it’s only fair that you share
originally posted on my blog and cross posted with SteemPress : http://theexcelclub.com/data-analysis-and-visualization-in-excel/
I think perhaps because I already had my own analysis ‘patterns’ that I was comfortable with, I never really looked at what these tools had to offer. Thanks to this post, I see that I need to do some more exploring of the newer features than I have before!
the new features are rather amazing. I plan on covering more of them over the next few weeks. they really move excel from a 'hell in a cell' situation to a multidimensional model
I am working from Excel 2016. Excel 365 seems to have a lot of new features. Ideas looks amazing. I am still learning formulas and I can't create pivot tables yet. But from what you have shown, it looks like I might not need to learn so much if Ideas can analyze the data and create the pivot table for me. I have to get Excel 365.
Although excel is moving very fast, I would recommend that you still learn how to do these things for your self. Imagine you got a value you were not expecting, how would you troubleshoot if you don't know how it all works
Microsoft will put me out of a job with all these new features. Ideas is very powerful, a big time saver, and a tool even new excel users can quickly get good results from.
Microsoft is moving fast thats for sure.
Congratulations @theexcelclub! You have completed the following achievement on the Steem blockchain and have been rewarded with new badge(s) :
You can view your badges on your Steem Board and compare to others on the Steem Ranking
If you no longer want to receive notifications, reply to this comment with the word
STOPVote for @Steemitboard as a witness to get one more award and increased upvotes!