Using ChatGpt To Optimize Trading
Lately i have seen a lot of videos , and read a lot of tweets on how to use Chatgpt to creat a script that can be used in tradingview. The script will provide you with a strategy on how to time buy and sell signals , some are using the Simple moving averages others the Exponential moving averages etc. So i thought why not try using Chatgpt to do the same of course with different parameters and with what i have in mind of using. So i tried two different scripts one for a strategy that can also be used to trade if i connect trading view with an exchange and an indicator.
Strategy
I asked for this This code implements a Hull, RSI, CCI, OBV, MACD Divergence strategy in TradingView using the Pine Script language. The strategy uses input parameters such as hull length, RSI length, CCI length, OBV length, fast length, slow length, and signal smoothing length to calculate technical indicators such as hull moving average, RSI, CCI, OBV, and MACD. The strategy then enters long or short positions when there is a bullish or bearish divergence in the indicators, respectively. It also exits the position when there is a bearish or bullish divergence, respectively.
It initially worked and on the strategy testing it gave a really good profit but when trying to use it again it's like it has errors that is almost unsolvable.
//@version=5
strategy("Hull, RSI, CCI, OBV, MACD Divergence Strategy", overlay=true)
// Input parameters
hull_length = input.int(title="Hull Length", defval=14, minval=1)
rsi_length = input.int(title="RSI Length", defval=14, minval=1)
cci_length = input.int(title="CCI Length", defval=14, minval=1)
obv_length = input.int(title="OBV Length", defval=14, minval=1)
fast_length = input.int(title="Fast Length", defval=12, minval=1)
slow_length = input.int(title="Slow Length", defval=26, minval=1)
signal_length = input.int(title="Signal Smoothing Length", defval=9, minval=1)
// Calculate indicators
hull = ta.hma(ta.ema(close, hull_length*2) - ta.ema(close, hull_length), math.sqrt(hull_length))
rsi = ta.rsi(close, rsi_length)
cci = ta.cci(high, low, close, cci_length)
obv = ta.obv(close, volume)
[macd, signal, _] = ta.macd(close, fast_length, slow_length, signal_length)
// Calculate divergences
rsi_divergence = ta.divergence(rsi, 2)
cci_divergence = ta.divergence(cci, 2)
obv_divergence = ta.divergence(obv, 2)
macd_divergence = ta.divergence(macd, 2)
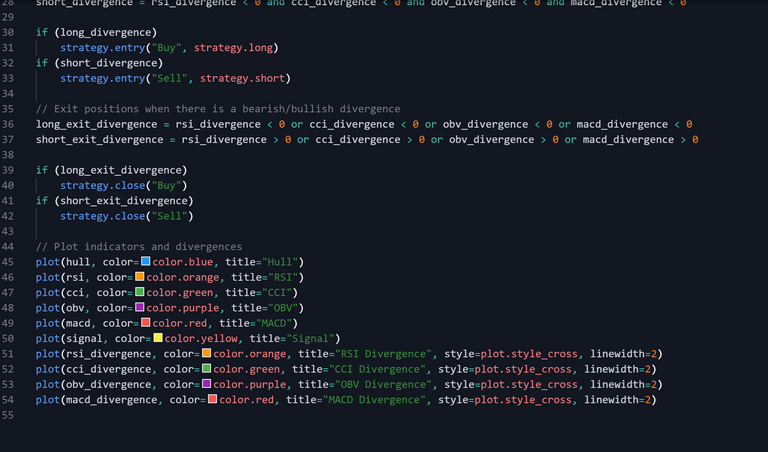
// Enter long/short positions when there is a bullish/bearish divergence
long_divergence = rsi_divergence > 0 and cci_divergence > 0 and obv_divergence > 0 and macd_divergence > 0
short_divergence = rsi_divergence < 0 and cci_divergence < 0 and obv_divergence < 0 and macd_divergence < 0
if (long_divergence)
strategy.entry("Buy", strategy.long)
if (short_divergence)
strategy.entry("Sell", strategy.short)
// Exit positions when there is a bearish/bullish divergence
long_exit_divergence = rsi_divergence < 0 or cci_divergence < 0 or obv_divergence < 0 or macd_divergence < 0
short_exit_divergence = rsi_divergence > 0 or cci_divergence > 0 or obv_divergence > 0 or macd_divergence > 0
if (long_exit_divergence)
strategy.close("Buy")
if (short_exit_divergence)
strategy.close("Sell")
// Plot indicators and divergences
plot(hull, color=color.blue, title="Hull")
plot(rsi, color=color.orange, title="RSI")
plot(cci, color=color.green, title="CCI")
plot(obv, color=color.purple, title="OBV")
plot(macd, color=color.red, title="MACD")
plot(signal, color=color.yellow, title="Signal")
plot(rsi_divergence, color=color.orange, title="RSI Divergence", style=plot.style_cross, linewidth=2)
plot(cci_divergence, color=color.green, title="CCI Divergence", style=plot.style_cross, linewidth=2)
plot(obv_divergence, color=color.purple, title="OBV Divergence", style=plot.style_cross, linewidth=2)
plot(macd_divergence, color=color.red, title="MACD Divergence", style=plot.style_cross, linewidth=2)
The second thing i asked was a Divergence Indicator with Hull 50, Support, and Resistance
//@version=5
indicator("Divergence Indicator with Hull 50, Support, and Resistance Optimized", overlay=true)
// Define input variables
rsi_len = input.int(14, title="RSI Length")
rsi_oversold = input.int(30, title="RSI Oversold")
rsi_overbought = input.int(70, title="RSI Overbought")
macd_fast = input.int(12, title="MACD Fast Length")
macd_slow = input.int(26, title="MACD Slow Length")
macd_signal = input.int(9, title="MACD Signal Length")
obv_ma = input.source(title="OBV MA Source", defval=close)
cci_len = input.int(14, title="CCI Length")
stoch_len = input.int(14, title="Stochastic Length")
stoch_smooth = input.int(3, title="Stochastic Smoothing")
hull_len = input.int(50, title="Hull Moving Average Length")
atr_len = input.int(14, title="ATR Length")
// Calculate indicators
src = hl2
rsi = ta.rsi(src, rsi_len)
[macd_line, macd_signal_line, _] = ta.macd(src, macd_fast, macd_slow, macd_signal)
obv = obv(close, volume)
obv_ma_val = ta.sma(obv, obv_ma)
cci = ta.cci(high, low, close, cci_len)
[stoch_k, stoch_d] = ta.stoch(high, low, close, length=stoch_len, smoothK=stoch_smooth, smoothD=stoch_smooth)
hull = ta.hma(src, hull_len)
// Calculate support and resistance levels
atr = ta.atr(src, atr_len)
support = ta.lowest(low - atr * 2, atr_len * 4)
resistance = ta.highest(high + atr * 2, atr_len * 4)
// Plot the indicators on the chart
show_rsi = input.bool(true, "Show RSI")
if show_rsi
plot(rsi, color=color.orange, title="RSI")
hline(rsi_oversold, color=color.black)
hline(rsi_overbought, color=color.black)
show_macd = input.bool(true, "Show MACD")
if show_macd
plot(macd_line, color=color.blue, title="MACD Line")
plot(macd_signal_line, color=color.yellow, title="Signal Line")
plot(macd_line - macd_signal_line, color=macd_line[1] < macd_signal_line[1] ? color.green : color.red, title="Histogram")
show_obv = input.bool(true, "Show OBV")
if show_obv
plot(obv_ma_val, color=color.orange, title="OBV MA")
plot(obv, color=color.blue, title="OBV")
show_cci = input.bool(true, "Show CCI")
if show_cci
plot(cci, color=color.orange, title="CCI")
show_stoch = input.bool(true, "Show Stochastic")
if show_stoch
plot(stoch_d, color=color.blue, title="Stochastic")
show_hull = input.bool(true, "Show Hull MA")
if show_hull
plot(hull, color=color.purple, title="Hull MA")
// Plot support and resistance levels
show_srl = input.bool(true, "Show Support/Resistance")
if show_srl
plot(support, color=color.green, title="Support")
plot(resistance, color=color.red, title="Resistance")
That one doesn't work i tried a lot copying the errors and then chatgpt correcting them but a new error was always poping.
The reason i used chatgpt is because it makes things easier and if you set you parameters right you will get an excellent result, I will keep on trying until i am able to put what i have in my head in a pine script.
Posted Using LeoFinance Alpha
That's cool!
thanks
Markets have a way of bucking bots and AI-generated data. From my own experience, the higher timeframes seem to be the most reliable.
Yes higher time frames always gives better picture . low or high its how you want to trade
In an article I published I commented on the usefulness and multiple benefits obtained by combining AI with blockchain technology. Your post is an example of what we can get.
Thank you very much
thanks. Exactly AI is the future just like blockchain
https://leofinance.io/threads/view/steemychicken1/re-steemychicken1-iuhxfiip
The rewards earned on this comment will go directly to the people ( steemychicken1 ) sharing the post on LeoThreads,LikeTu,dBuzz.
Very clever idea, I've considered the same idea but never had time to really get in and build anything. Are you using Chatgpt 4?
Well i am using the free version so i believe no??
I think 4 is a paid version but is supposed to be much better at solving programming issues. I've not tried it but have heard from a couple people it seems to work well. But that means shelling out cash which I hate to do, I use the free version as well.
Interesting - basically an ai trading bot
But Id probably still prefer a manual built Version - for managing funds, like in the past
So no real need for AI, especially since I dont trust it..
And dont know the one who built the system..
Or at least an owned/ open ai..
Actually that's also where AI Trends towards.. Many little Expert helpers
If it only Was not groomed by the elites..
Well not an AI exactly because it will just follow the code it want be able to learn because the code is basic. If that is that the do this etc.