Buying and Selling Game Contest 33 Results
Hi Everyone,
Welcome to the ‘Buying and Selling Game’ Contest 33 and final results post for the Buying and Selling Game Series. A new economics series will begin in 2023. Next month’s post will explain this new series of contests.
This post contains a video of the ‘Buying and Selling Game’ Excel Model. The model generates the selling prices for the goods described in the contest post. For contest 33, the participants had a choice of six types of donuts, which were available on 5 different planets, this contest goes outer space sometimes. Watch the video to find out what our participants did and who won the contest.
Winner determined in this video
What is the Buying and Selling Game?
For the benefit of those who have not entered this contest, here is a brief explanation of how the game works.
Participants are required to buy goods with an allocated amount of money. They are given a choice of 6 goods and all of these goods are available in any of the 5 towns, cities, islands or planets in the game. The buying prices of all goods are provided in the question.
The participants are then required to sell all of their goods on a future date. The selling prices for all goods in all towns, cities, islands or planets are not provided. Instead, the question provides a triangle distribution for the selling price of each good in each town, city, island or planet. For the triangle distribution, the minimum, maximum, and mode values are provided.
The participant who has the most money after selling all his or her goods is the winner.
Responses to the contest are made in the comments section of the post. If more than one participant makes the highest profit, the participant who entered (commented) first will win. The account with the winning entry will receive 30 Hive and the first 12 entries will be given upvotes. The most profitable buying and selling price combination is also calculated. If the winner adopts this strategy, he or she will receive an additional 10 Hive. If nobody makes a profit (i.e. zero or negative), the prize will be rolled over to the next contest.
The format of the required entry is explained in detail in the contest itself.
For a more detailed explanation, you can access the contest post using the following link.
Results of the Contest
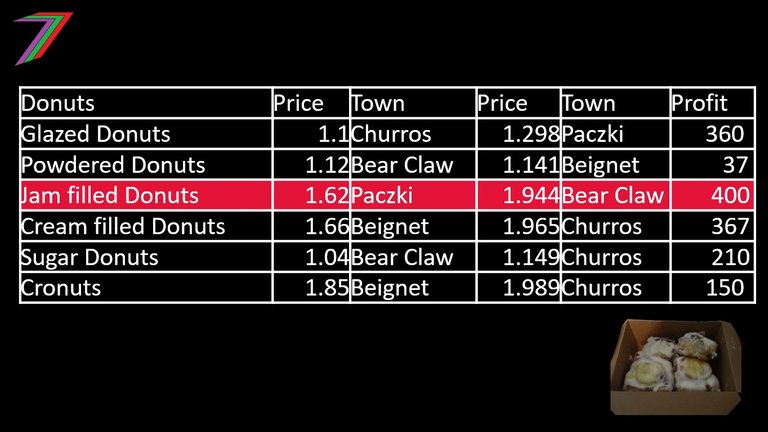
Table 1 contains the selling prices generated by the ‘Buying and Selling’ Game model for each type of donut on each planet.
Table 1: Selling prices of all donuts on each planet
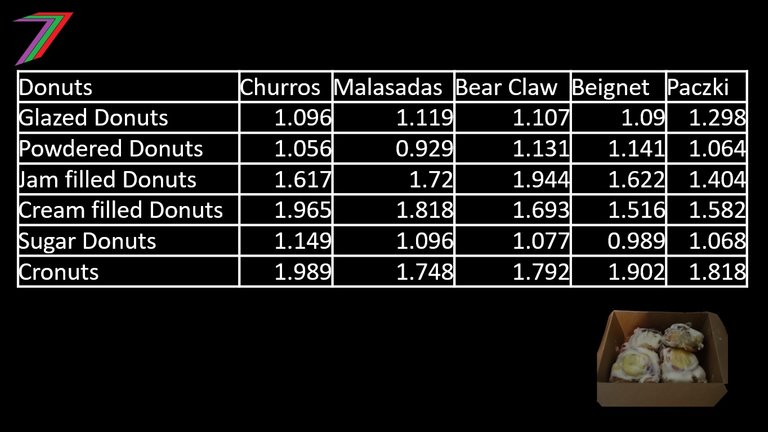
Table 2 contains the responses and the profit made by each participant.
Table 2: Participant responses and profit
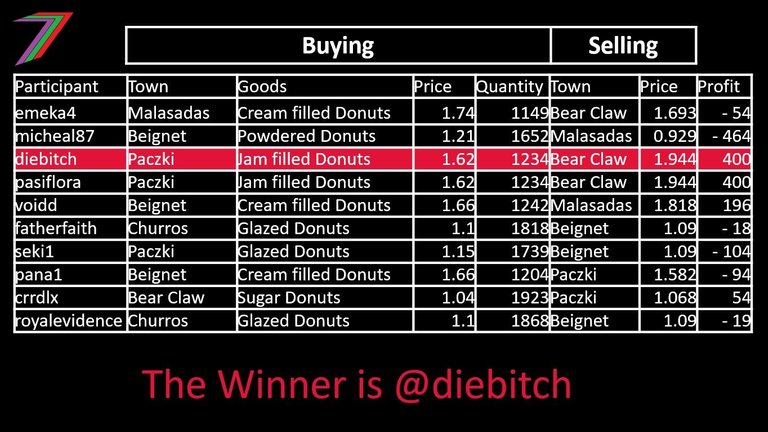
Congratulations to @diebitch for winning Contest 33 of the 'Buying and Selling’ Game and a prize of 30 Hive.
On Paczki, she bought 1234 jam filled donuts for $1.62 each. She paid a total of $1,999.08.
On Bear Claw, she sold the 1234 jam filled donuts for $1.944 each. She received a total revenue of $2398.90. Therefore, she made a profit of approximately $400 (2398.90 – 1999.08).
Highest possible profit
@diebitch also managed to obtain the highest possible profit for this contest. Therefore, wins an additional 10 Hive; thus, taking her winnings up to 40 Hive.
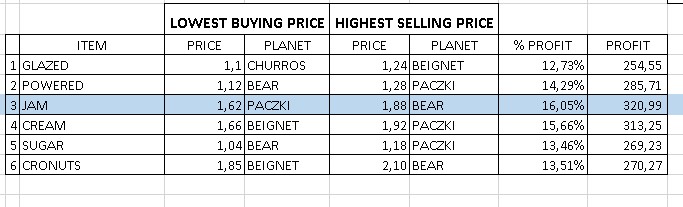
Table 3: Lowest buying price and highest selling price
I would also like to thank @crrdlx, @pana1, @emeka4, @fatherfaith, @pasiflora, @voidd, @seki1, @royalevidence, and @michael87 for participating. I look forward to seeing all of you in next year’s economics contest series and maybe in the Christmas challenge as well.
Tips for future games (If you want to participate in a future Buying and Selling Game (mostly likely in the 2023 7-Week Economics Challenge Series), I strongly recommend you read this section of the post)

To achieve the best chance of winning the game (i.e. earning the highest profit). Participants need to make the best use of the information they are given. The participant should buy from the place that sells the good at the lowest price and sell at the place that will offer the highest price.
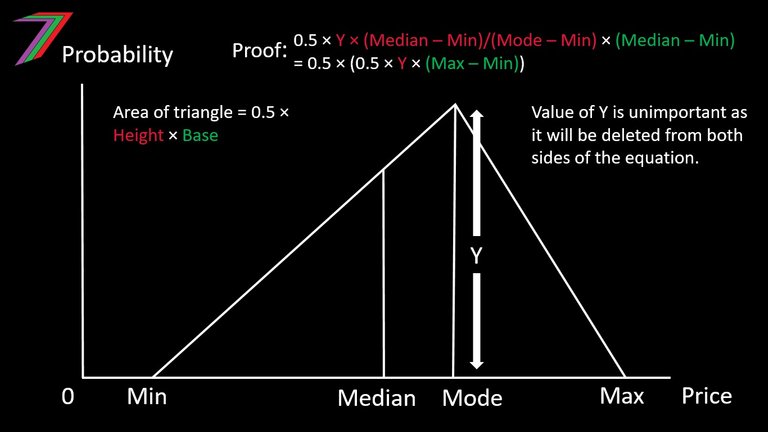
To inform the decision further, participants should also consider the mean and median prices for each good in each place. The mean and median for a triangle distribution can be calculated using the following formulae.
Mean = (Minimum + Maximum + Mode)/3
Median when Mode ≥ (maximum – minimum)/2 (i.e. mode closer to maximum)
Minimum + (((maximum – minimum) × (mode – minimum))/2)0.5
Median when Mode ≤ (maximum – minimum)/2 (i.e. mode closer to minimum)
Maximum - (((maximum – minimum) × (maximum – mode))/2)0.5
Proof Median
More posts

If you want to read any of my other posts, you can click on the links below. These links will lead you to posts containing my collection of works. These 'Collection of Works' posts have been updated to contain links to the Hive versions of my posts.


Hive: Future of Social Media

Spectrumecons on the Hive blockchain

▶️ 3Speak
Yay I won. Thanks for hosting this!
Congratulations, awesome job.
Economics isn't for me 🤕😅
-103$ profit 😭
Congratulations to the winner
ohhh I must practice my speed!!. what a bad luck mine. Well congratulations to the winner and thanks to @spectrumecons
It is important to be aware of what other participants have entered. You cannot win if you enter the same response as someone else. There were many possible combinations that had reasonable chances of winning.
Congratulations to the winner