Economics 7 Week Challenge Series 2022 – Challenge 3: Tax Game
Hi Everyone,
Welcome to the Economics 7 Week Challenge Series for 2022. Over 7 weeks, in the months of August and September, I will be running an economics challenge series. This series will consist of 7 challenges. Five of these challenges will be returning from last year’s Challenge Series and two of them are completely new. Below are the list of challenges.
- Challenge 1: Auction
- Challenge 2: Buying and Selling Game (Business Version)
- Challenge 3: Tax Game (New)
- Challenge 4: Game Theory
- Challenge 5: Make Me Happy
- Challenge 6: Buying and Selling Game (Original Version)
- Challenge 7: Pick-a-door (New)
Each challenge could reward winners with as much as 60 Hive. The value of the prize will depend on the level of participation. For each new participant, the prize will increase by 5 Hive. This will continue until 60 Hive is reached (12 participants). The first 12 participants will also receive a 50% upvote from this account. In addition to the prize money, the top few participants will be given points. These points will be used to determine the overall challenge series winner. This winner may receive as much as 80 Hive. The value of the prize will equal the sum of the number of participants across all challenges. This will continue until 80 Hive is reached.

For more information on the challenge series and the upcoming challenges, I recommend that you read my post Spectrumecons Seven-Week Challenge 2022 (Coming Soon) and watch my video.
Welcome to Challenge 3: Tax Game
How to Play?
Taxation is a very divisive topic. Most people do not like paying taxes. Some people believe it is a necessary evil as many initiatives cannot or should not be funded by the private sector of the economy. Others believe that the Government are inefficient and incompetent and should not be trusted with large sums of money. Some people would even claim that Governments are corrupt and focused on serving their own needs with very little or no regard for the people they claim to represent. This challenge requires participants to put their beliefs regarding tax to one side. Participants need to make decisions regarding tax rate based on what they believe will happen to income and welfare based on the parameters outlined in this challenge.
For this challenge participants are required to set the tax rate for a very small country. Tax has been simplified to just a percentage of overall income (i.e. no distinction between different taxes such as income tax, corporate tax, GST, etc.). The current tax rate and national income are provided in the question. The participants are required to set the tax rate yearly for the next 3 years (i.e. rate in Year 1, Year 2, and Year 3). They can choose any tax rate they please (anywhere between 0% and 100%). Changing the tax rate will have both benefits and costs. For example, lowering the tax rate will raise income but, if tax revenue falls as a result of a lower tax rate, there could be a social cost of reduced funding of services provided by the Government. However, social costs will be reduced in the following year as it is assumed the market will partially adjust to lower or higher Government spending.
The extent of the increase in income and changes in social cost will be determined in a Microsoft Excel model. The participants will be provided a range of possible values for parameters for key determinants of income and social cost.
All entries must be made in the comments section of this post.
Each account is only permitted one entry.
Objectives of the game
Participants should aim to maximise the sum of national income for the 3 years plus or minus changes in social costs during that same period. The participant that achieves this will win the challenge.
Game Assumptions
- Reducing tax encourages economic activity and increasing tax discourages economic activity. The extent of the change in economic activity is determined through an algorithm (see formulae section).
- Reducing tax comes with an immediate cost. The extent of this cost is determined by the welfare penalty parameter outlined in the formulae section.
- The cost of reducing tax is reduced over time as the economy adjusts to reduced Government expenditure. The extent of this adjustment is determine by the welfare recovery parameter (see formulae section).
- Increasing tax does not produce immediate additional benefits. The welfare recovery parameter is also used to determine the lag in receiving these benefits. The absence of these benefits are presented in the results as a social cost.
- Participants have no control over how tax revenue is used.
- Population is assumed to remain unchanged over the 3 years.
- Income, tax revenue, and welfare are assumed to be unaffected by anything beyond the information described in this challenge.
What information is provided?
- Current National Income
- Current tax rate expressed as a percentage
- Current total tax revenue
- Range for sensitivity of income to tax rate
- Range for welfare recovery from tax shock
- Range for welfare penalty parameter from tax shock
Formulae
Below are formulae used to calculate income, tax revenue, and social cost for changes in tax rate.
New Income = Existing Income × (1-New Tax RateX)/(1 -Existing Tax RateX)
New Tax Revenue = New Income × New Tax Rate
Welfare Penalty for Tax Revenue Reduction (YR1) =(2 + (ETR -TR(Yr1))/ETR)Y/2^Y
Welfare Penalty for Tax Revenue Reduction (YR2) =(2 + ( TR(Yr1) - TR(Yr2))/ TR(Yr1))Y/2^Y
Welfare Penalty for Tax Revenue Reduction (YR3) =(2 + ( TR(Yr2) - TR(Yr3))/ TR(Yr2))Y/2^Y
Social Cost (Yr1) = (ETR– TR(Yr1)) × WP(YR1)
Social Cost (Yr2) = 1/Z(ETR-TR(Yr1) × WP(YR1) + (TR(Yr2)-TR(Yr1)) × WP(YR2)
Social Cost (Yr3) = 1/Z2(ETR-TR(Yr1)) × WP(YR1) + 1/Z(TR(Yr2)-TR(Yr1)) × WP(YR2) + (TR(Yr3)-TR(Yr2)) × WP(YR3)
Net Outcome = New Income – Social Cost
Total = Net Outcome(YR1) + Net Outcome(YR2) + Net Outcome(YR3)
Where:
X = Parameter to determine sensitivity of income to tax rate. Value ranges between 1 and 1.5 (uniform distribution).
Y = Parameter to determine welfare penalty from reduced Government spending (Note: parameter excluded from tax rate increases). Value ranges between 3 and 5 (uniform distribution).
Z = Parameter for welfare recovery from changes in tax rate. Reduces impact based on the economy’s ability to adapt. Value ranges between 1 and 2 (uniform distribution).
ETR = Existing Tax Revenue
TR(YR) = Tax Revenue in respective year
WP(YR) = Welfare Penalty of tax revenue reduction in respective year
To gain a better understanding of the impact changing tax rate could have on income and tax revenue see the Figures 1, 2, 3 and 4.
Figure 1: Income at different tax rates when parameter X = 1.5 (Maximum)
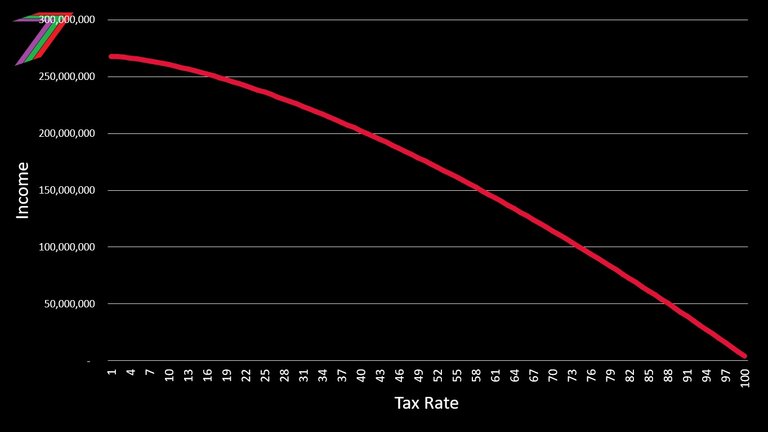
Figure 2: Income at different tax rates when parameter X = 1 (Minimum)
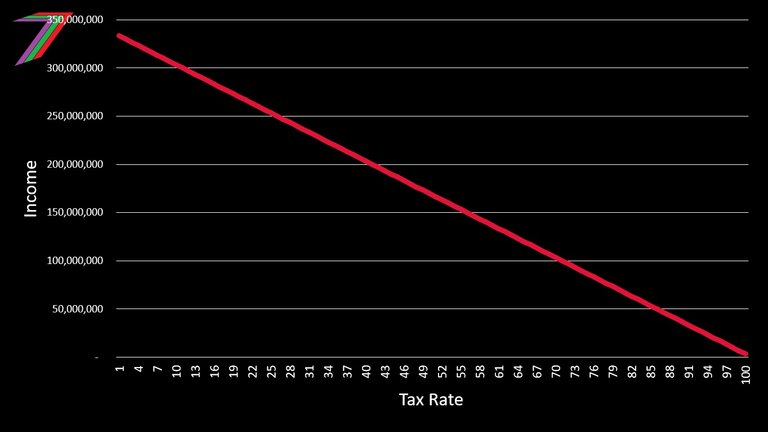
Figure 3: Relationship between Tax Revenue and Tax Rate when parameter X = 1.5 (Maximum)
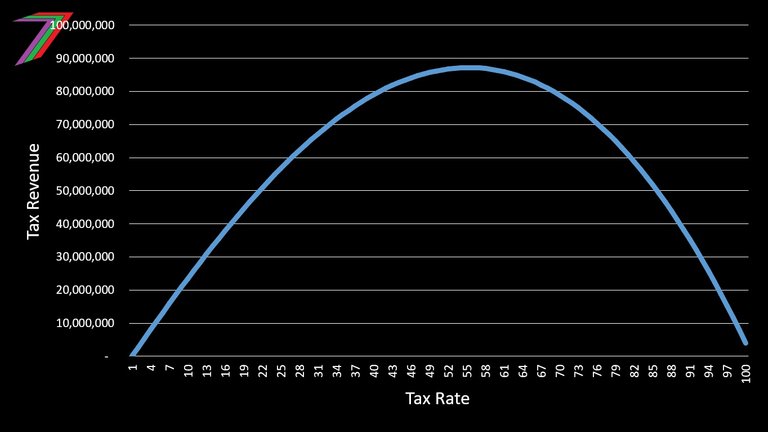
Figure 4: Relationship between Tax Revenue and Tax Rate when parameter X = 1 (Minimum)
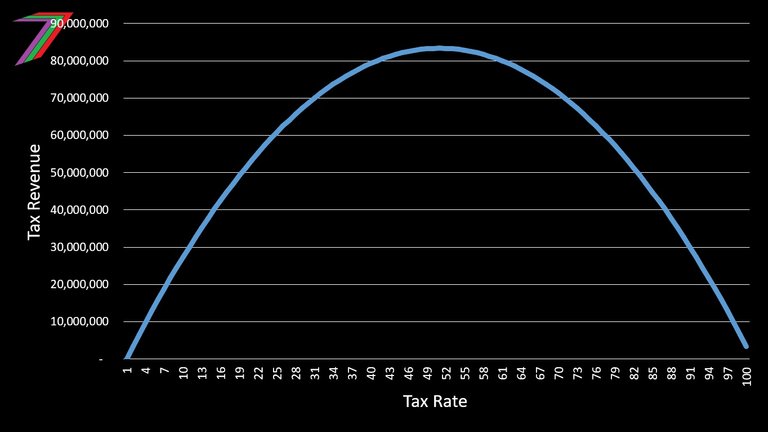
Note: Values on the y-axis are based on values provided later in the question.
To gain a better understanding of the impact the welfare penalty has on social costs see Figure 5.
Figure 5: The social cost of reducing tax revenue when parameter Y = 3 and 5
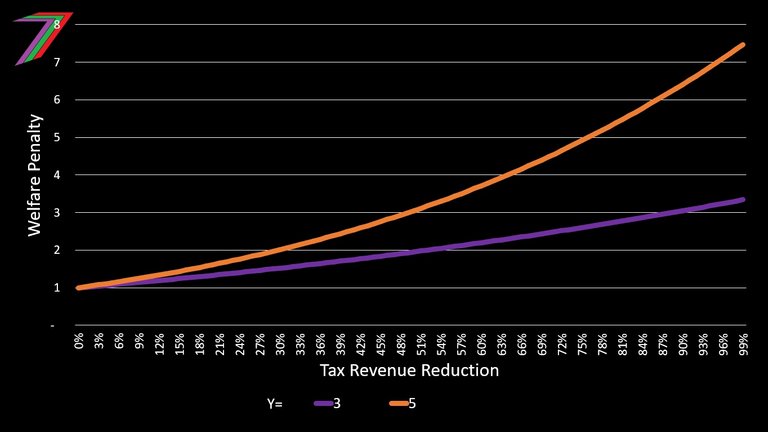
The welfare penalty increases as tax revenue falls. The parameter determines the extent of this increase.
How are the results of the game determined?
A Microsoft Excel Model is used to determine the values of national incomes and social costs for each year. The model generates the values for the parameters for income sensitivity to tax rate, welfare penalty, and welfare recovery. The results post will contain a video of the generation of the values. The winner will be announced in both the video and written post.
Contest Prizes
The total prize for this challenge could reach as high as 60 Hive. The number of participants determines the value of the prize. For every entry, the prize is increased by 5 Hive until a value of 60 Hive is reached. The winner will receive 2/3 of the prize and second place will receive 1/3. The first 12 entries will be given upvotes. The winner of this challenge will be given 30 points, second place 20 points, and third place 10 points. These points will be tallied at the end of the challenge series to determine the overall winner.
Let the challenge begin
Participants are required to enter tax rates for Year’s 1, 2, and 3. Information regarding the existing income, Government’s current tax rate, and tax revenue are shown in Table 1.
Table 1: Existing Income, Tax Rate, and Tax Revenue
| Item | Value |
|---|---|
| Tax Rate | 40% |
| Income | 200,000,000 |
| Tax Revenue | 80,000,000 |
| Social Cost | 0 |
| Net Outcome | 200,000,000 |
See the formulae section for the algorithms used to determine income, tax revenue, social costs, and net outcomes. The formulae section also contains the ranges for key parameters in these algorithms.
Entry format
For this challenge, I expect to see entries made in the following format:
Tax Rate Year 1:
Tax Rate Year 2:
Tax Rate Year 3:
Example of entry
Tax Rate Year 1: 30%
Tax Rate Year 2: 22%
Tax Rate Year 3: 15%
The closing date and time for this challenge is 6PM coordinated universal time (UTC) 25/08/2022. Responses after this time will not be accepted. The winners will be announced in the results post along with the video containing the generation of values for each item.
I hope everyone has fun and enjoys this new challenge. I look forward to your participation in the fourth challenge.
More posts

If you want to read any of my other posts, you can click on the links below. These links will lead you to posts containing my collection of works. These 'Collection of Works' posts have been updated to contain links to the Hive versions of my posts.

Hive: Future of Social Media

Spectrumecons on the Hive blockchain

Tax Rate Year 1: 45%
Tax Rate Year 2: 43%
Tax Rate Year 3: 46%
Posted Using LeoFinance Beta
Tax Rate Year 1: 15%
Tax Rate Year 2: 25%
Tax Rate Year 3: 80%
Tax Rate Year 1: 20%
Tax Rate Year 2: 30%
Tax Rate Year 3: 33%
Tax Rate Year 1: 18%
Tax Rate Year 2: 29%
Tax Rate Year 3: 32%
ax Rate Year 1: 20%
Tax Rate Year 2: 30%
Tax Rate Year 3: 50%
Posted Using LeoFinance Beta
Tax rate year 1: 40%
Tax rate year 2: 55%
Tax rate year 3: 62%
Tax Rate Year 1: 26%
Tax Rate Year 2: 23%
Tax Rate Year 3: 20%
Tax Rate year 1: 20%
Tax Rate year 2: 35%
Tax Rate year 3:45%
Tax Rate Year 1: 25%
Tax Rate Year 2: 25%
Tax Rate Year 3: 25%
Interesting challenge :) I'm not that good with spreadsheets and had trouble understanding how those parameters are used in calculations so in the end I went with my gut feeling :) lower and stable taxes are the best! :) @tipu curate
Upvoted 👌 (Mana: 32/42) Liquid rewards.
That's a reasonable approach.
Tax Rate Year 1: 25%
Tax Rate Year 2: 22%
Tax Rate Year 3: 15%
https://twitter.com/spectrumecons/status/1562368827668811777
The rewards earned on this comment will go directly to the people sharing the post on Twitter as long as they are registered with @poshtoken. Sign up at https://hiveposh.com.
Tax Rate Year 1: 20%
Tax Rate Year 2: 15%
Tax Rate Year 3: 15%
Tax rate year 1 : 20 %
Tax rate year 2: 22.5%
Tax rate year 3: 25%
Tax Rate Year 1: 22%
Tax Rate Year 2: 15%
Tax Rate Year 3: 15%
Tax Rate Year 1: 20%
Tax Rate Year 2: 17%
Tax Rate Year 3: 15%
Sorry, challenge has closed.