8 March My Technical Analysis

BTC
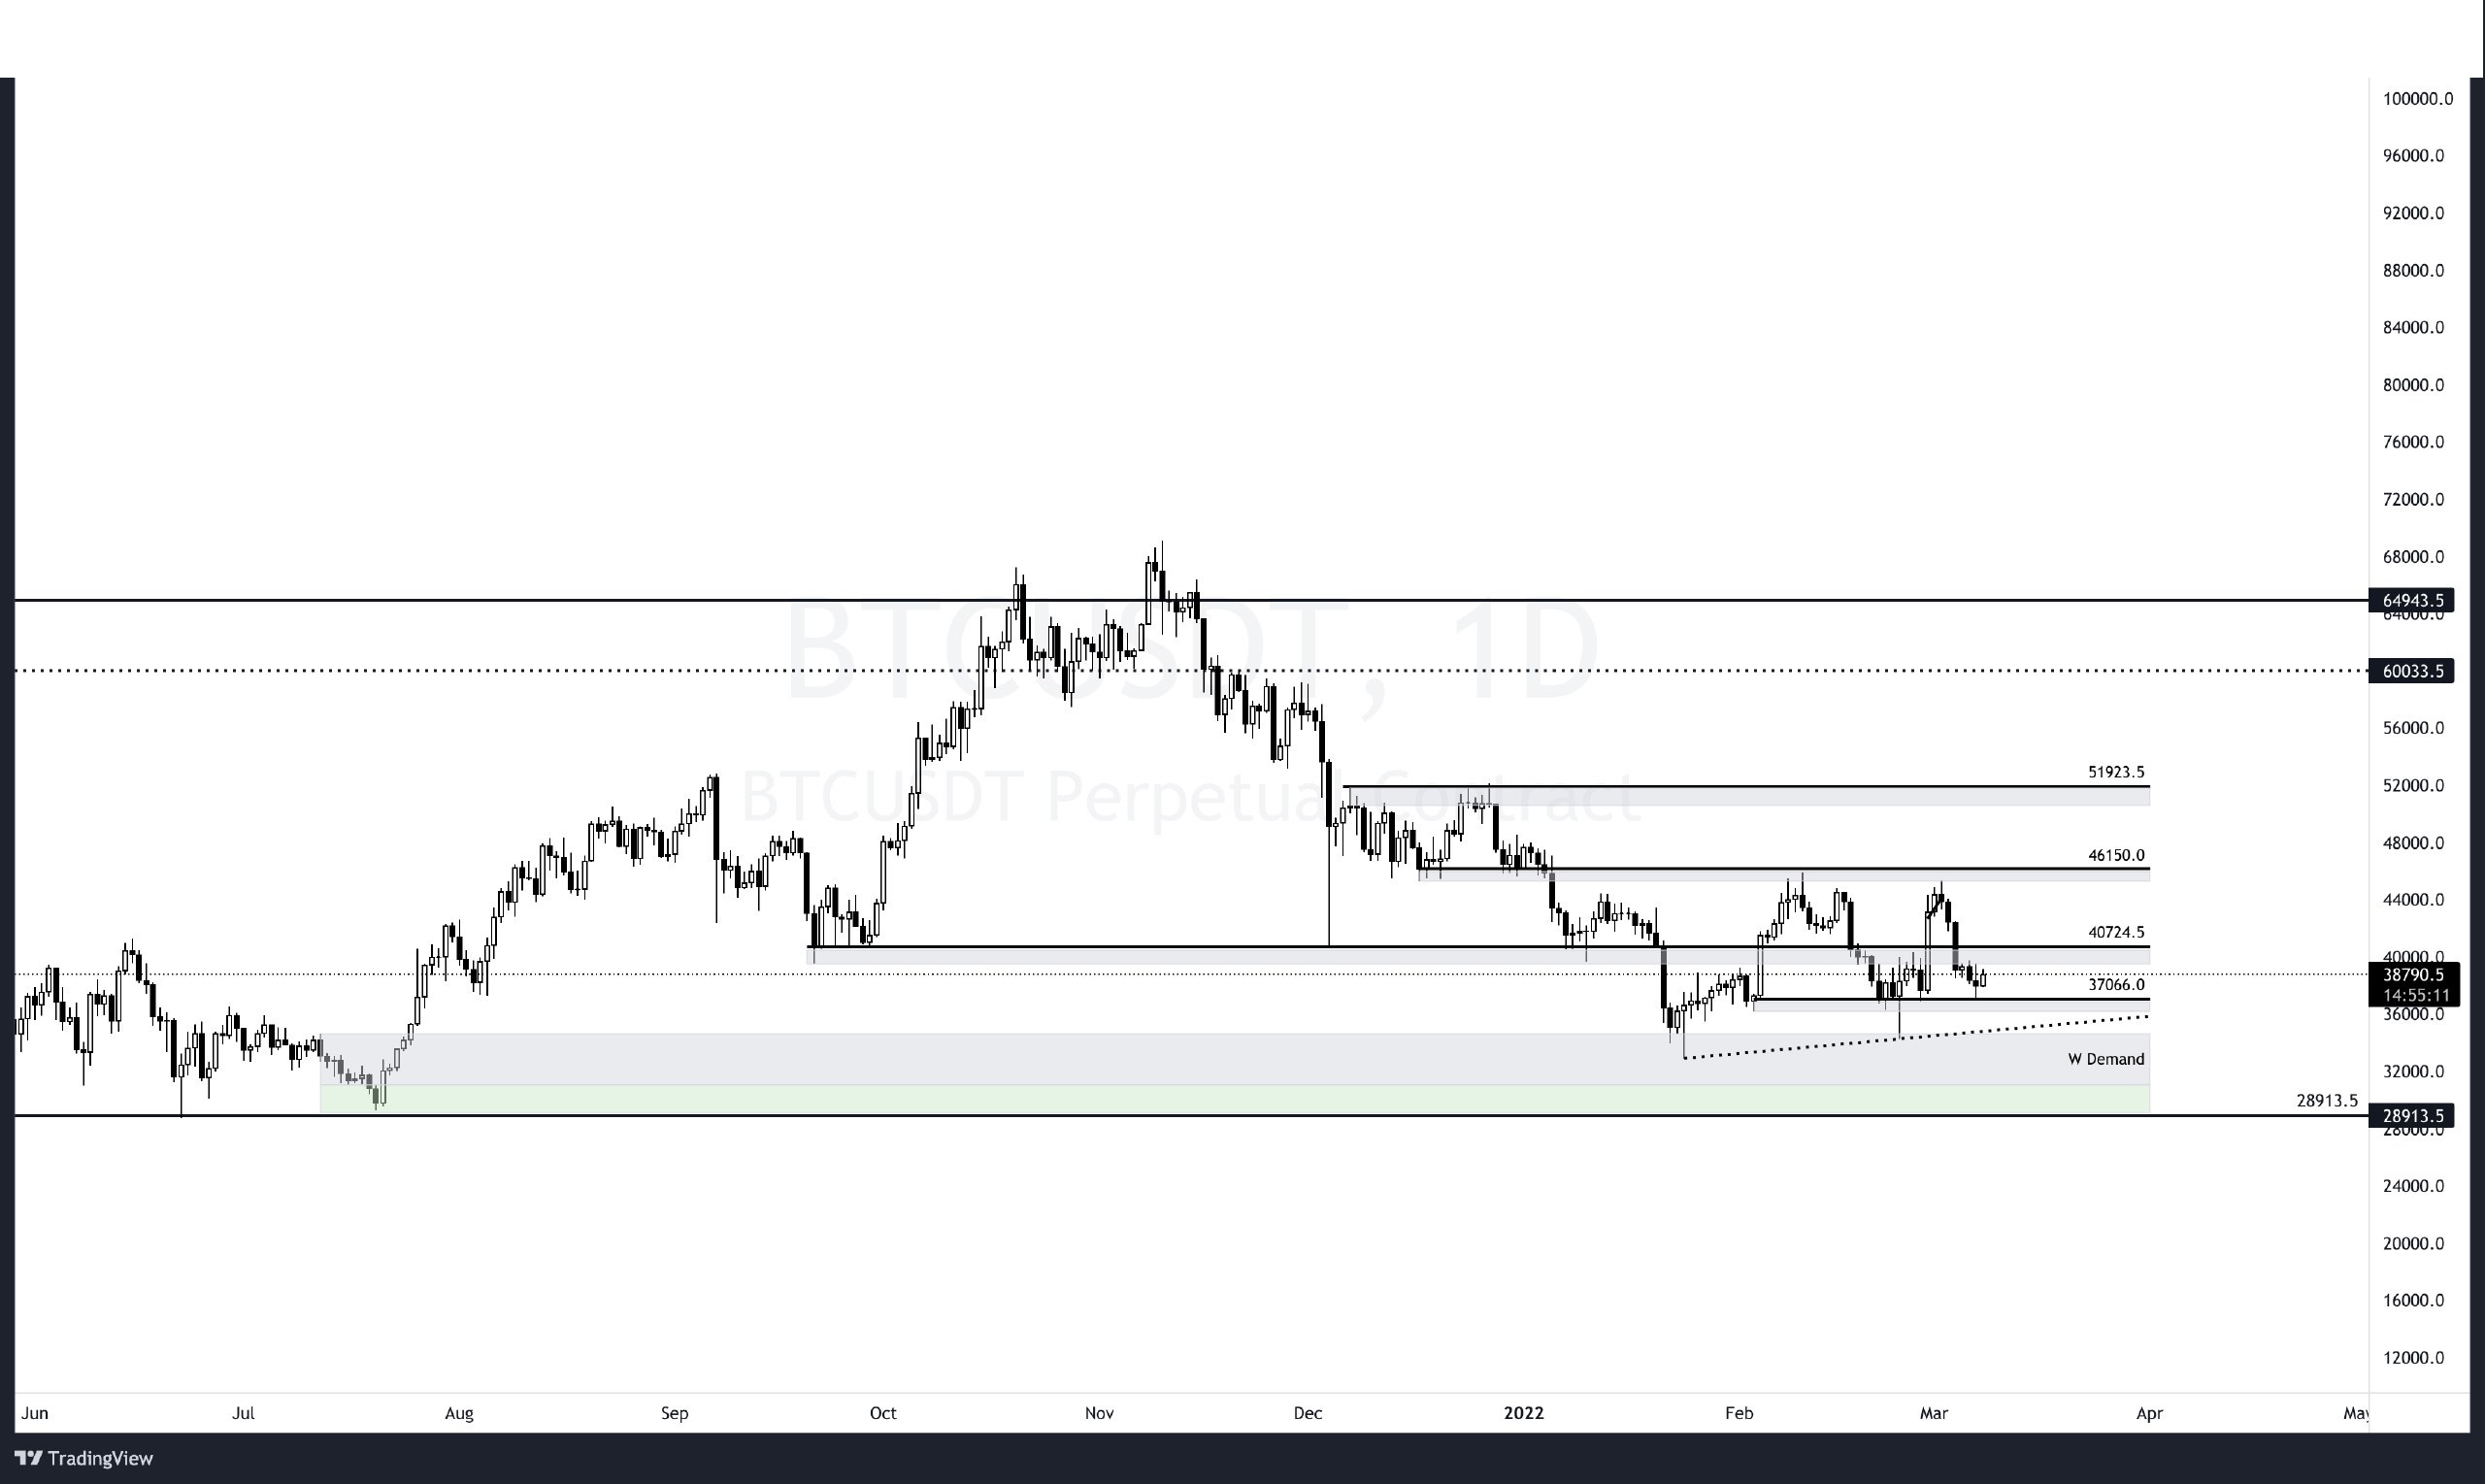
First of all, let's look at the analysis and results on the daily chart from where we left off last week.
We discussed the return to the old region below 40.7 and the possible decrease to 37 again in the analysis.
37K played a critical role for BTC both in February and January. For this reason, it is natural for this place to produce a reaction in the decrease from 40.7 to here.
Our chart and the places we marked work like clockwork. Now let's talk about the size of the reaction, I think 40.7 (+/-500 USD ) would be reasonable for this reaction.
The first and slightly more likely scenario is a decrease to around 35.5/35 when the reaction is over. Let's use the dotted trend line as a reference, which I added to the chart here, hourly closings that may come one after the other will be a sign that the decline will deepen.

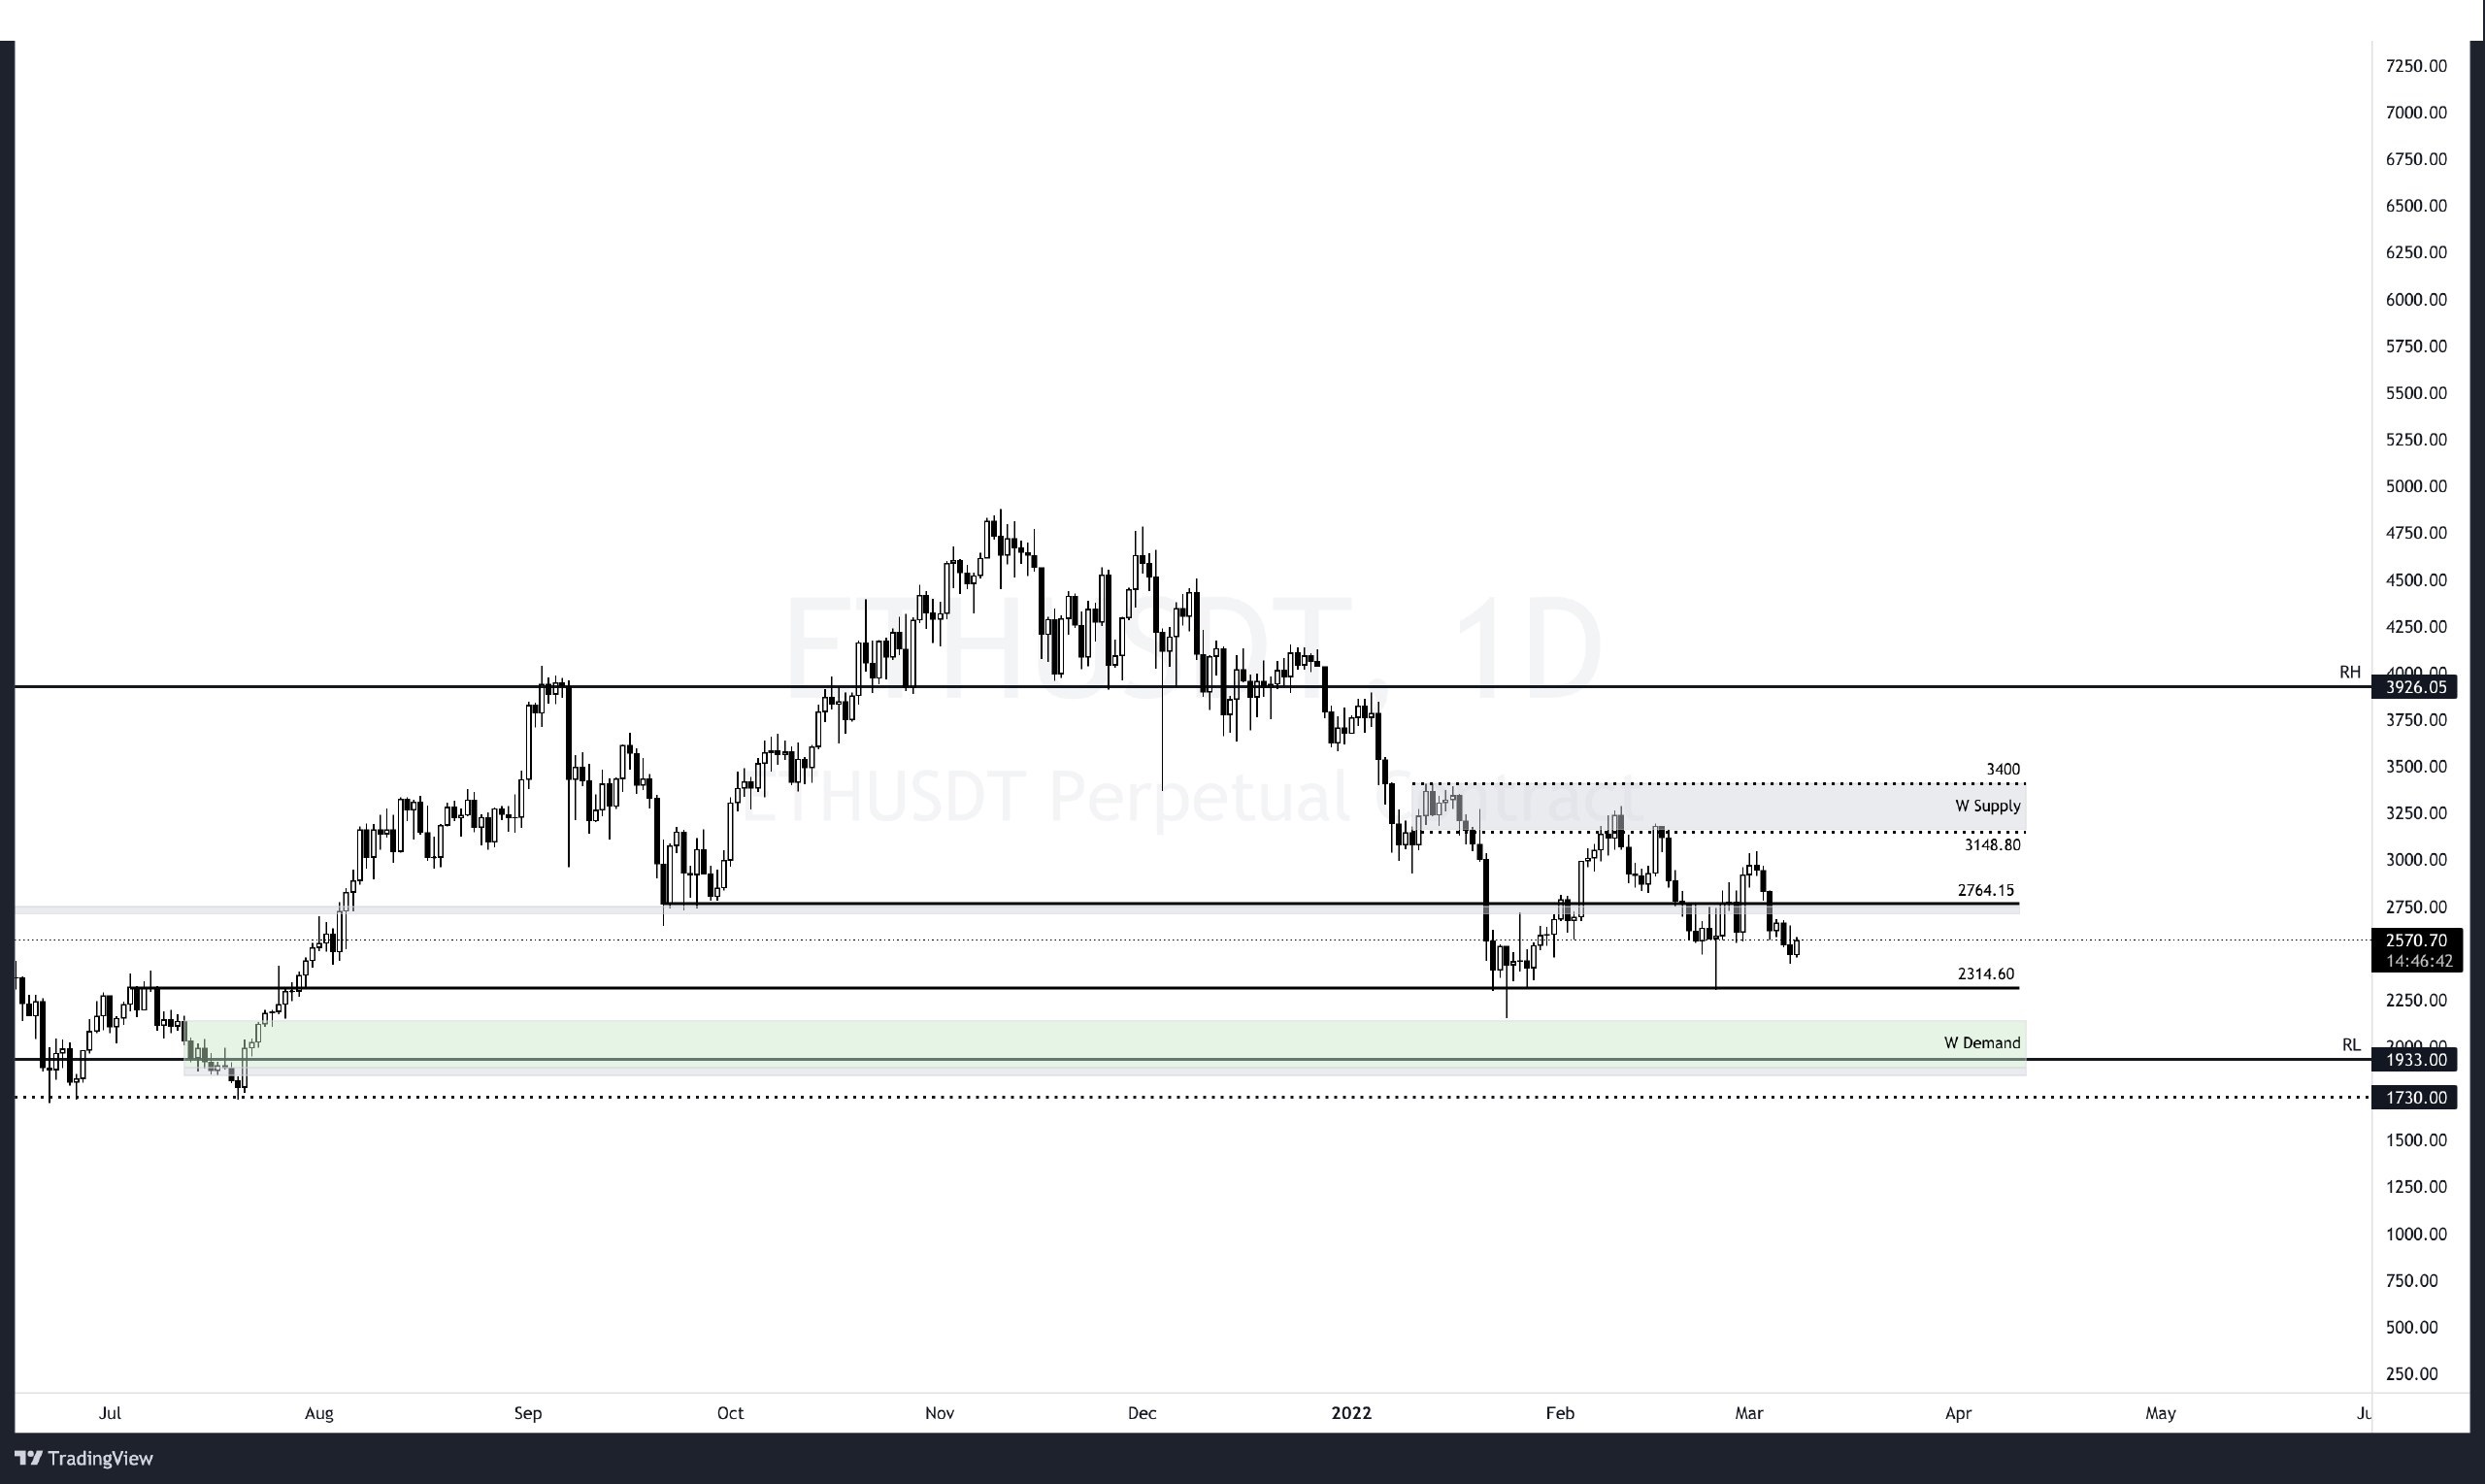
$ETH 2570 USD is the critical value of the local base it formed in 8 days at the end of February and is currently trading below this figure. I think it is worse than $BTC, I expect a drop from around 2700 to around 2314 again, either from here or a little higher. However, if there are daily closures above 2764, it would be useful to re-evaluate this idea. You can use this as an invalidation.
Good luck with,
It is not investment advice.
Posted Using LeoFinance Beta