See you at the 40K Bitcoin! - Technical Analysis

Hello friends!
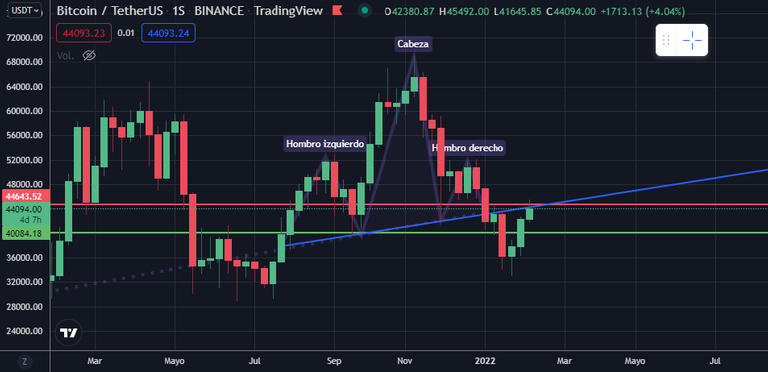
It is surely no surprise to most that we are experiencing a sharp decline in bitcoin prices since several months ago (November 09), and the underlying was forming a well-known pattern, which signals a trend reversal, the head shoulders pattern.
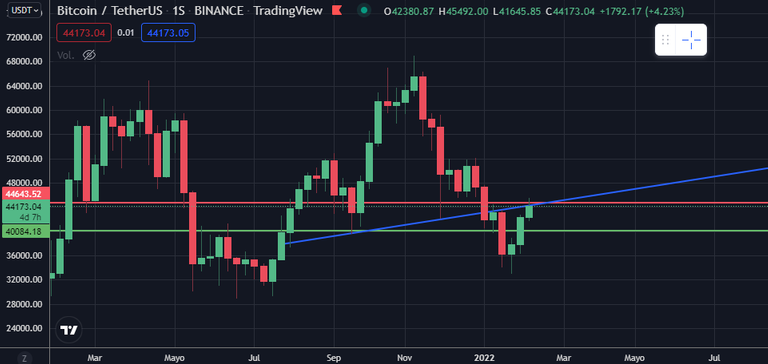
We can see how the neckline of the head and shoulders pattern is the blue trend line drawn on the charts below, which currently coincides with the value of 44400 USD.
At the time, at the end of the formation of the pattern, the price broke the neckline generating a decline to 40000 USD, and then performing the confirmation pullback to the trend line which is in turn, the neckline of the pattern.
Note: These first charts shown, are of weekly timeframe, so this pattern development and these confirmations are quite strong.
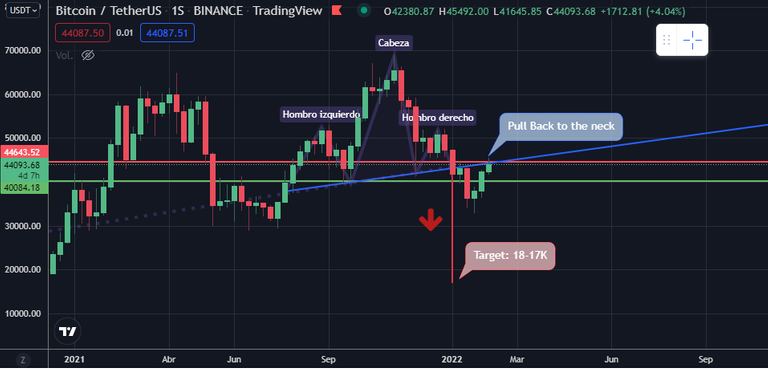
In the third weekly chart shown below, we can see how a second retest or perhaps pullback to the real line (current momentum) at 44.400 USD has occurred, where the price is still below this strong resistance.
And if it is correctly rejected by this pattern neckline, we would have a downward movement (in the medium term), to values below 20K. Obviously it would be hasty to think that we will go directly to this point, because on the way there are multiple supports that the price must test and areas of liquidations that will push the price again looking to overcome the resistances that used to be old supports.
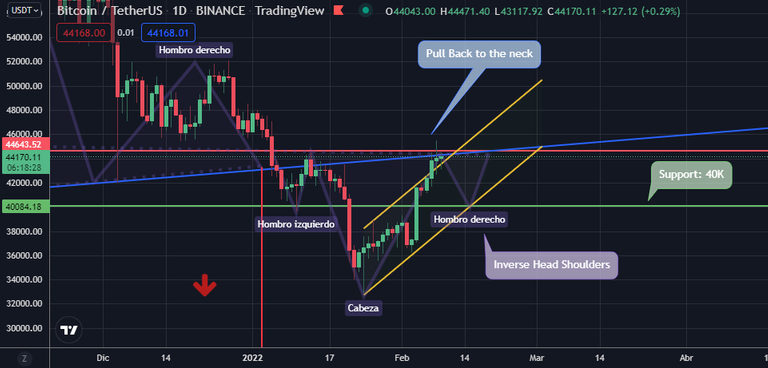
Precisely as on the way we will be able to see multiple movements towards the supports that the asset has, we zoom, now to the daily timeframe chart and we can see how after its bounce at 33150 USD, Bitcoin has started to conform an apparent Inverted Head-Shoulders pattern, with neckline at the trendline of 44. 400 USD (where we are now), and its conformation is on course now (from my opinion) to draw the Right Shoulder, giving us a possibility to Short trade up to 40,000 USD again, and that as we can see in the chart coincides in turn with an ascending parallel channel that also came developing. This would be a support for the price to bounce once again and test for the fourth time the resistance of 44,400 USD (perhaps this time with a successful break).
TWO WAYS:
The moment the price tries to break this neckline of the still incomplete Head Shoulders, the bullish path may occur and breakout, seeking again to regain the 52,000 USD values. And in this way, having finished the movement of the first Head Shoulders pattern that took us to the 20K, approximately.
The moment the price tries to break this neckline of the still incomplete Head Shoulders, the bearish path may occur and not succeed in the breakout, descending back to the 42K or perhaps further down to the 40K.
As in this case, we will probably be close to the US interest rate hike, probably the FUD will do its job and we will go down to values between 30K and 20K.

I hope it has been of benefit to you, the sharing of my analysis and that it can nourish at least a little bit your own analysis for your own decision making.
Thanks for reading and I will see you in the market.
If you want to join Binance Exchange, click here and SIGN UP

Interesting analysis. But Wen moon?
Posted Using LeoFinance Beta
Hahaha may be after March. But who knows, BTC is capricious, it could be tomorrow at 60000 USD and all the analysis would be meaningless. Hahaha or be at 20000 USD.
For now, the healthiest thing is the rebound to 40,000 USD I guess.
True that.
Hehe makes sense. Nice one
Posted Using LeoFinance Beta
Thank you!