Crypto Market is finally getting set to recover, so these charts indicate!!
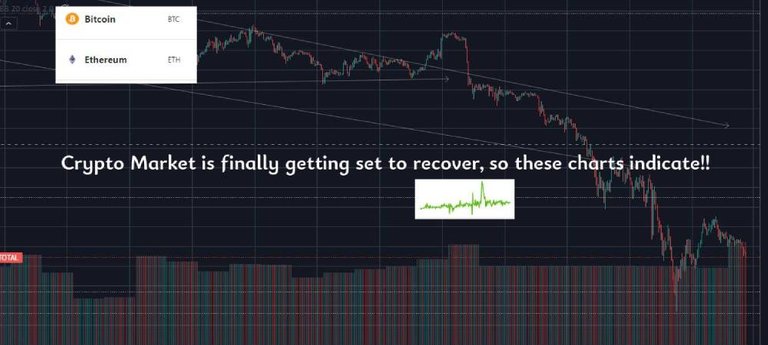
Sunshine after the storm so it seems in the Crypto Market - Oh that devastating storm!!
Well… after all that bloodshed and UST’s mega depeg with Luna’s crash to 0, yesterday it looked as if that turbulent bleeding had finally ended in the crypto market. So, it looked like sunshine after the storm, and it did cheer me up, because I have lost hard due to this Luna and UST crash chaos.
No, I am not quitting being in crypto space and will keep continuing my journey, because leaving crypto will really be my death spiral. My self worth will crash to 0, and I know nothing else to currently do in life. I have said earlier that crypto is my religion, so I guess these episodes are testing my faith in crypto.
Alright, I don’t want to appear like a crypto fanatic and would have gladly had one of my cats present this crypto post, but I am not able to plan their presentation script, quite tired after the crypto dramas and definitely need to take a break.
Anyway…
There, I wish I rest and they work now, doing a crypto article!!
Technical Analysis of various charts now indicate a sign of recovery
Here is why I feel that perhaps crypto’s bleeding phase has ended with the recovery phase set in.
The various price charts show that selling has stopped and buyers have entered.
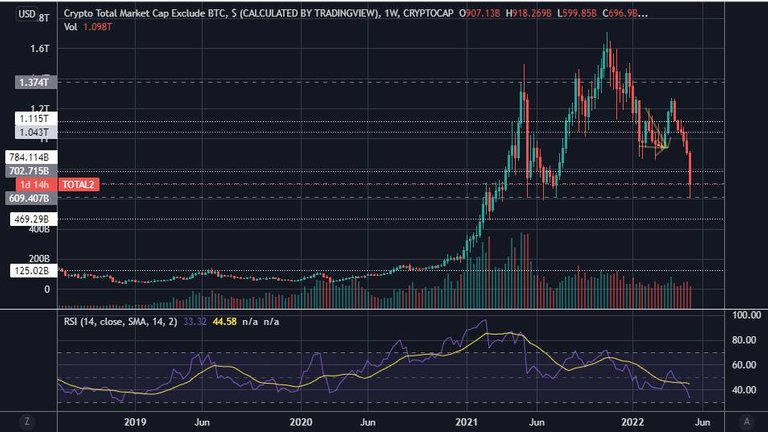
Technical Analysis of Total Crypto Market Capitalisation
Let’s start with the Total Crypto Market Capitalisation Chart -:
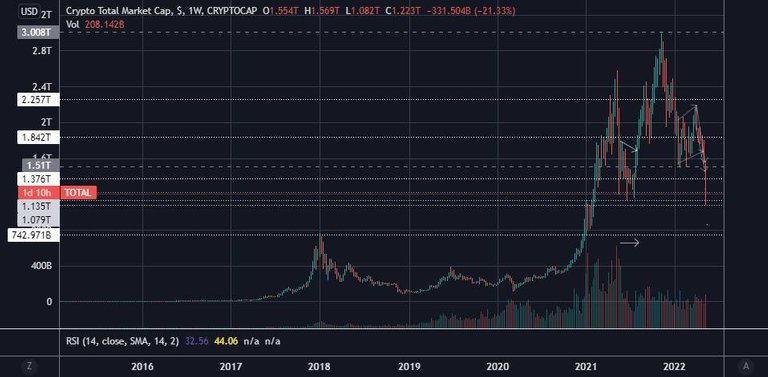
On the weekly chart, it can clearly be seen that Market Capitalisation hit the low of 1.079 $ Trillion, after which there is support, with the elongated candle wick indicating that buyers have come in to do crypto shopping, buying the crypto dips.
Last, recent lows in Total Crypto Market Cap was within the 1,135$ Trillion Range that happened in June of last year. There is a triple Bottom pattern there, where Total Crypto Market Capitalisation was touching this level on May, June and July of last year because crypto buying activity took place and Crypto Market Cap kept flying up till it reached ATH ranges of 2.8$ Trillion on November 8 of last year.
So, it’s possible that a bottom has reached with the Total Crypto Market Capitalisation finding support at this current range.
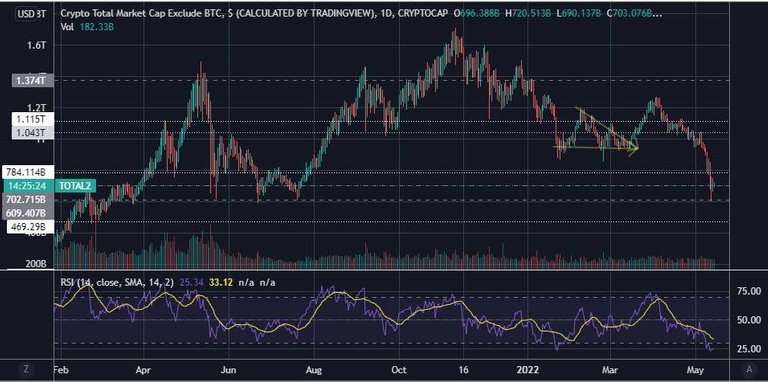
Let’s look at the daily chart
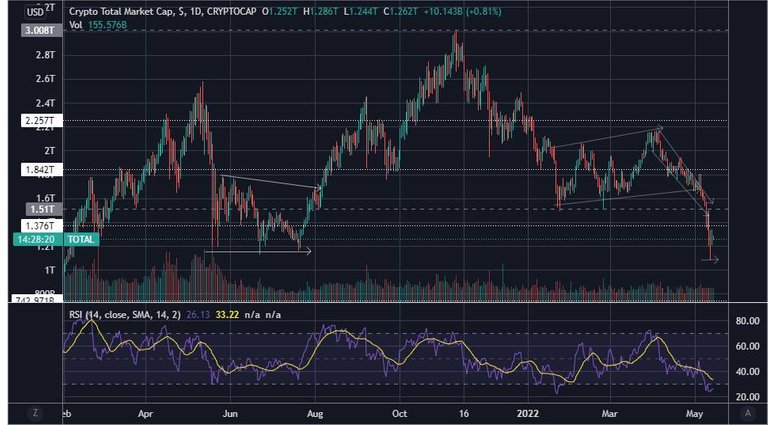
Currently, it shows that at $ 1.079 Trillon, the Crypto Total Market Cap has bouched up to $ 1.20 Trillion and no buying activity is happening much, because maybe investors want to rest in the weekend. Shrugs!!
Notice the elongated wick that shows the bounce, it means that buyers immediately entered the market. This is interesting.
Technical Analysis of Total Market Capitalisation of Alt Coins
Right, this was the total Crypto Market Capitalisation including that of Bitcoin, but how about Total Crypto Market Capitalisation of Alt coins?.
Let’s look at the chart of total crypto Market Capitalisation excluding Bitcoin obviously from tradingview.
In the weekly chart it shows, selling of Alt coins stopped and found support at a neat range of $609 Billion dollars. I call it neat because this is the support level where the last Total Alt Coin Market Cap low was. Yes, a triple bottom pattern is here.
This is the range at which buyers came in, and things became very bullish as the Total Alt coin market Cap flew to $1.72 Trillion ATH range on 8th November, after which Market Cap kept falling due to selling and maybe the bottom has now reached?.
Let’s turn to the Total Alt Coin Market Cap's daily chart now.
There is an abrupt big bounce at the $609 Billion range taking the market cap up till $674 Billion Dollars and not much buying activity post that.
Looks nice and interesting to me.
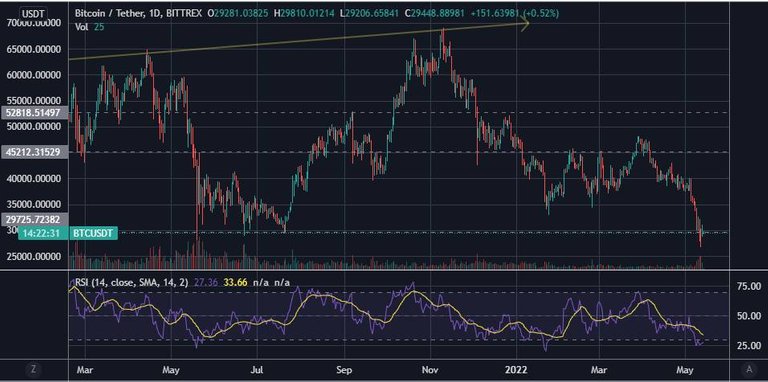
Technical Analysis of BTC Price
Shall we look at the BTC chart, the king crypto?
Before that I would like to tell you all something.
Sometimes, I think of fairytails because I just read the chronicles of Narnia and I read a tweet which would have if I was a charactor from those fairytales take my sword and fight with who ever tweeted that tweet.
In that tweet that person said, if a big project like Luna can fall, its just a matter of time that investors will lose confidence on BTC and it will crumble down.
I really wanted to tweet back, that it's also damn likely that the day is not far when fiat currencies like INR and USD will crumble, but I stopped because, I don’t want trolls, I like peace and calm. What to do, crypto is my religion and I felt that tweet was insulting the honour of BTC crypto majesty and all that… !!
Perhaps this difficult crypto phase is testing my faith in crypto, I believe crypto is my religion
Let’s check the BTC/USDT weekly chart
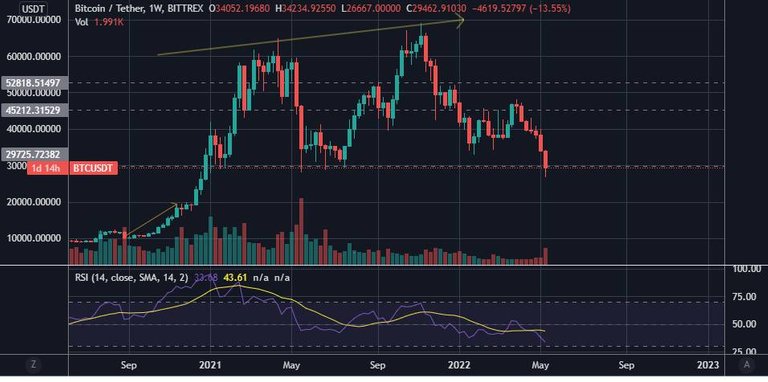
Weekly chart shows that of late, BTC is ususally brought up by investors when it comes down to just below 30,000$ level. So, yes at the range of 29,700$, there’s been a triple bottom before on the months of May, June and July last year while January of that year too had buyers come in to buy BTC at this range.
Post July from this range and after a prior period of consolidation BTC’s price went up till it reached its ATH price range of 69,500$. Post this BTC’s price has been on a decline and perhaps now BTC has reached its bottom, from where prices are bound to go up.
This time, buyers came in to buy BTC dips at 26,800 $ range, and the price bleed has stopped after finding support at this level.
Let’s turn to the BTC daily chart -:
Daily chart has shown that buyers came in to buy BTC at 26,800$ range and BTC’s price is now at 28,900$. The previous bottom support range of 29,725$ is serving as resistance for BTC. So, BTC is below the key psychological level of 30,000$
BTC's Hourly price chart has a inverse head and shoulders patern
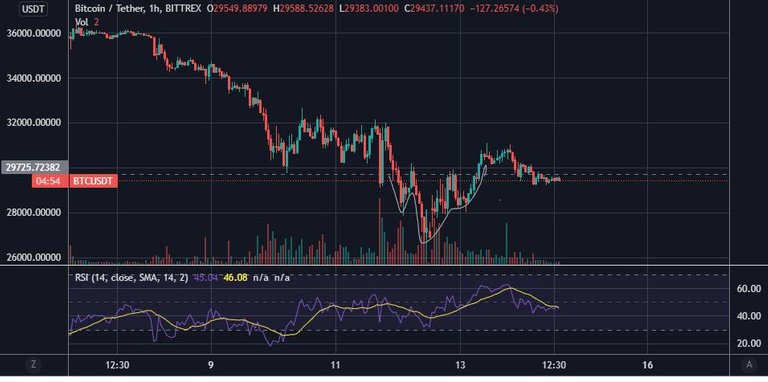
I also checked BTC’s hourly chart yesterday, and I think I found a bullish pattern they call inverse head and shoulders, although honestly, they say that in short time frames the patterns are not that accurate indicators as they will be in the long time frame say the weekly or monthly chart, so can’t conclude with this, but still it’s interesting.
Technical Analysis of ETH Price
Now, let's check the price chart of the second largest crypto, ETH. This will be our last chart discussion in this article.
ETH Weekly Chart
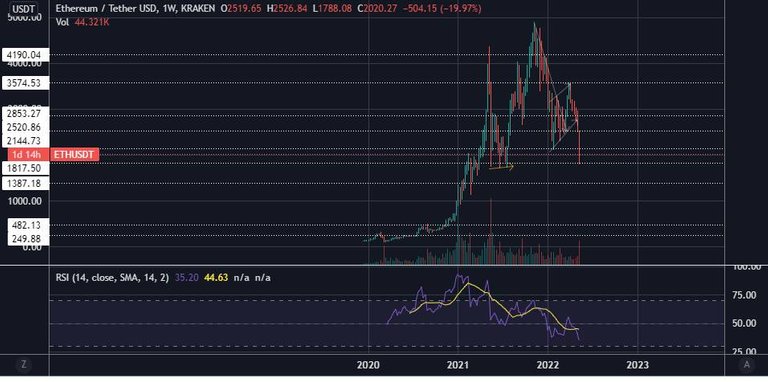
On the weekly chart, ETH neatly finds support at its previous low at 1800 $. Rest you can fill in the blanks…because ,at this range is the triple bottom pattern formed as discussed in other charts in the month of May, June and Jule of last year.
ETH then entered a bullish phase till the cycle ended on November 8th of last year when ETH price touched ATH of 4,600$, after which you can see price kept declining and it's possible that ETH has reached its bottom now.
ETH's Daily Chart
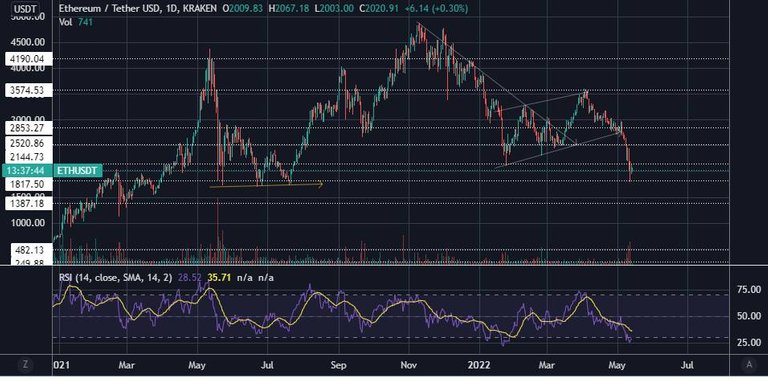
At the dialy chart you can see that ETH’s price has nicely bounced off the 1800$ range, meaning buyers have come to buy ETH at that range and its resistance is in the 2144$ range.
The End of the post
Well, it’s time to end. Just like life has its ups and downs and we make lots of mistakes, so it is in crypto. This reminds me of that saying which goes like this, one may have lost the battle, not the war. Truely, its difficult times, but what else can we do then sail through the tough tides although I do feel like a castaway now. Shrugs…
Perhaps I will do what I want to do now, that’s to go watch movie, “The voyage of the dawn treder”...blabbering goodbye.
They told me if I killed myself now it would save the lives of countless others.
Saying the longer I wait to kill myself the more people will suffer.
They are reckless and should have shown the proper media what they had before taking me hostage for 5 years. I know there are many in prison that dont deserve to be there because of this. Your stay in prison will not be fun @battleaxe and friends. People are going to want you dead when they find out what you did. I hope you die a slow painful death. You sick mother fuckers.
https://peakd.com/gangstalking/@acousticpulses/electronic-terrorism-and-gaslighting--if-you-downvote-this-post-you-are-part-of-the-problem
Its a terrorist act on American soil while some say its not real or Im a mental case. Many know its real. This is an ignored detrimental to humanity domestic and foreign threat. Ask informed soldiers in the American military what their oath is and tell them about the day you asked me why. Nobody has I guess. Maybe someone told ill informed soldiers they cant protect America from military leaders in control with ill intent. How do we protect locked up soldiers from telling the truth?
This post has been manually curated by @bhattg from Indiaunited community. Join us on our Discord Server.
Do you know that you can earn a passive income by delegating to @indiaunited. We share 100 % of the curation rewards with the delegators.
Here are some handy links for delegations: 100HP, 250HP, 500HP, 1000HP.
Read our latest announcement post to get more information.
Please contribute to the community by upvoting this comment and posts made by @indiaunited.