USA rates increase create more instability on BTC – 10 HIVE to be won (CAP reached)!
What market phase are we entering into has been the introductory question for our last appointments.
Welcome to Surfing the Market, we are already at our 24rd appointment and I hope that with these easy tech analysis we have helped you in some forms, even just to evaluate different market perspectives.
Let’s start from our usual weekly perspective
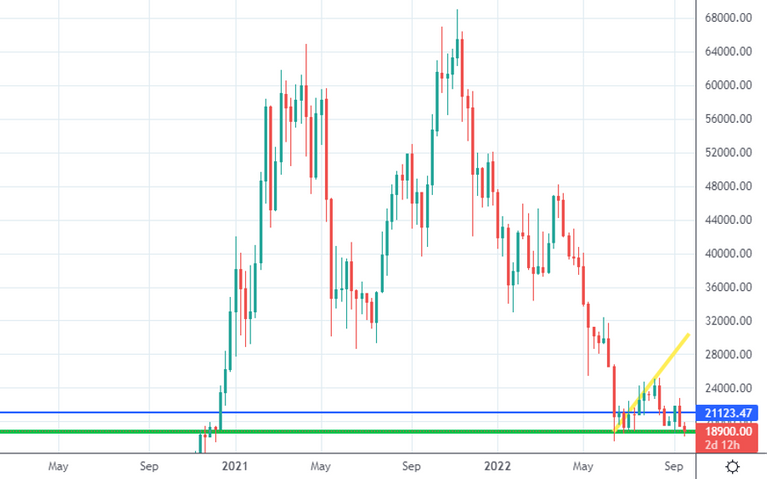
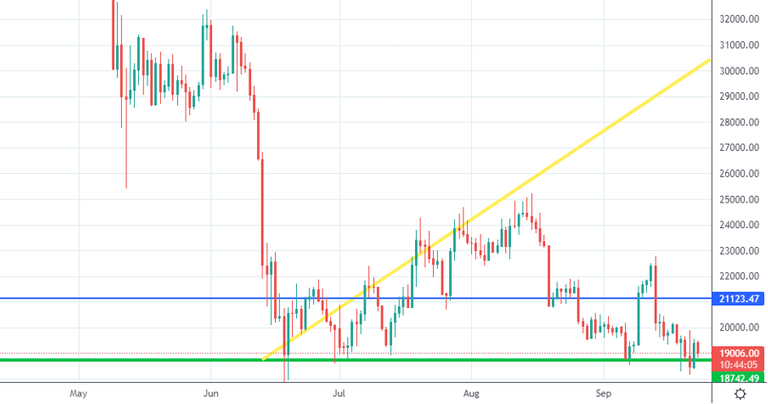
WEEKLY CHART - Source: Tradingview
Price is now struggling to resist above the green line after another strong setback from USA rates communication, increased to 3.75% (https://www.reuters.com/markets/europe/central-banks-unleash-350-basis-points-more-rate-hikes-inflation-fight-2022-09-22/) that created even more confusion and fear in the market. And it seems like the rates are going to potentially increase even more, up to 4.4%-4.6% until the end of this year.
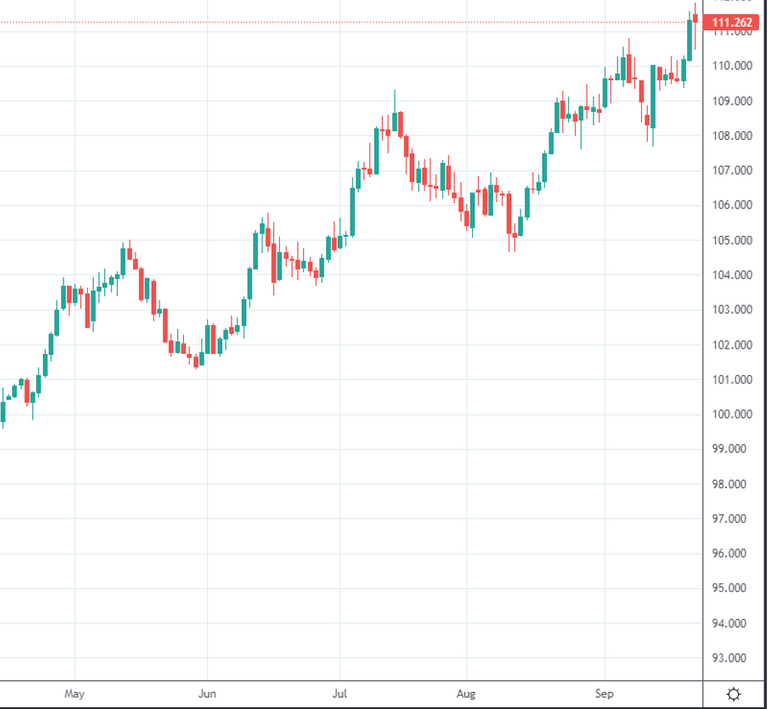
Screenshot on a D-TimeFrame of the Dollar Currency Index
Dollar Strength Index is showing even more strength after recent rates increase, meaning that debtors to the USA nation and banks will owe more money in interests, potentially allowing to reabsorb some monetary mass from the FED, and here is an interesting fact:
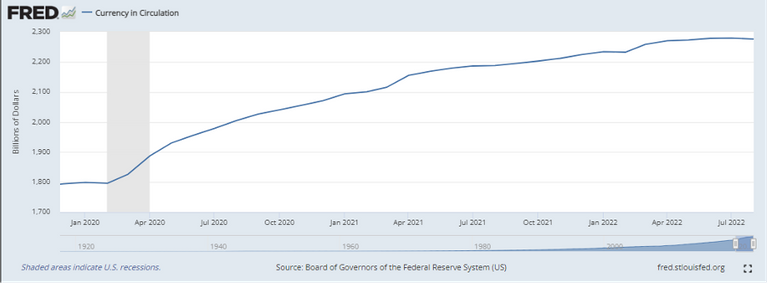
A month of circulating monetary mass contraction happened and in the last two years and a half, we only had two months of USA monetary contraction. This is potentially a first attempt to limit the financial inflation, but not enough and too slow to avoid the soon coming inflation spiral.
Do you know why my target for trading is gaining portions of BTC to be higher than exactly 0.003 BTC? Give your answer here in the comments. The winner will receive 10 Hive.
We reached the cap at 10 HIVE, so make sure you take part into the contest so we will create another one!
What do I expect from a daily perspective?
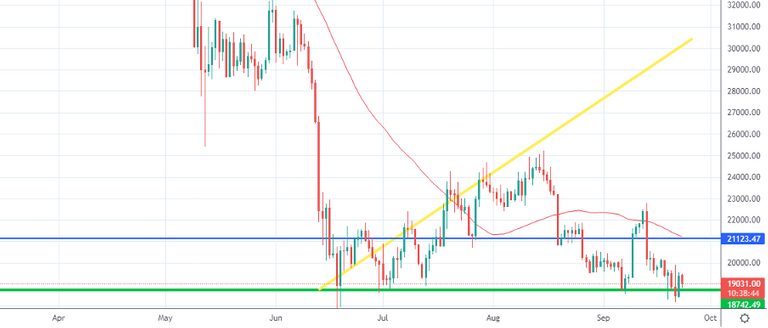
DAILY CHART - Source: Tradingview
We are at the same level from last week, 3.2 trillions of $ have expired and now we do not have revolutionary news in the coming days, meaning that Bitcoin may have some space for a natural (and breathing) price increase.
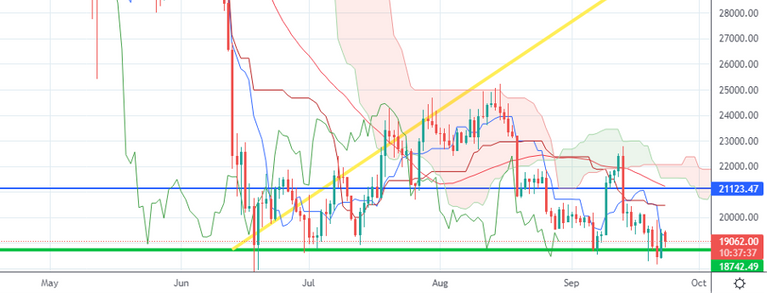
DAILY CHART - Souce: Tradingview
50MA is crossing down the static blue resistance, making it a strong level to be broken but also a strong statistical area where the price may try to get back soon.
Ichimoku Cloud are far from the current price level, meaning that at the moment, on this timeframe, do not have relevant indications from them.
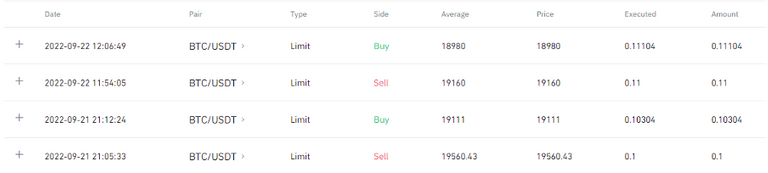
If the last week I brought some positions in profit against the dollar, when the market is even more bearish, it’s time to accumulate!
What to observe particularly?
We are still in an unstable range, so I would wait taking further positions and I will sure wait the response of the two moments I mentioned above! But if signals will remain stable, I will be slightly bullish (again). What I am doing are short-term positions to be carried some hours at the most.
I am waiting a 20k$ breakout to see more upward movements.
Let me know what you think about this new weekly appointment, and what indicators you would like to be taken into consideration more (or even explained).
Stay tuned and be sure to follow to get noticed when my contents come out.

Promotional suggestion
One more thing: if you really do not care of technical analysis or you do not like spending time onto the markets, make sure to give a look to the Zignaly platform, an Official Binance Broker Partner with huge volumes under management. They offer great services of Profit Sharing Trading, where you copy other Professional traders, sharing the profit with them! Make sure to give a look!
If you are interested in getting noticed in advanced on the release of our partner’s indicators, leave a comment here so we understand if there is some interest!
None of what I write can represent a financial advice in any form. So Do your own research before taking any kind of action.
Scusa!! Il dollar index è sopra i 110? Ho capito bene?
eh sì!
https://it.tradingview.com/chart/D8c6aSED/?symbol=INDEX%3ADXY
Impressionante, mi ricordavo il dollar index a 95… era da un po’ che non guardavo questo indice