Understanding Trading Crypto With Average Directional Index (ADX) Indicator
Hello everyone, hope you all are doing good? This is the beginning of an exciting three part series, which promises to be informative and also educative, do well to follow all the parts, as you will definitely gain 1 or 2 useful information from the series. In today's article we would be looking at understanding of the ADX indicator and how it is calculated.

From my understanding of ADX indicator also known as Average Directional Index, it is not a stand alone indicator which helps determine price movement for traders, rather it is a supporting indicator that helps to measure the strength of a trend.
To fully utilize the ADX indicator for trading purposes, you need to add some other good indicators such as Pivot Points and Ichimoku indicator. The reason for this, is that, ADX indicator is a slow indicator, it gets to detect signals a bit late, but that doesn't take away the fact that it is a very good indicator which can be used to know the strength of a trend, which is quite very good for scalp traders, as they will keep making profits, since they know the trend is strong or very strong.
Take a look at the XRP/USDT chart below to know how an ADX indicator looks like.
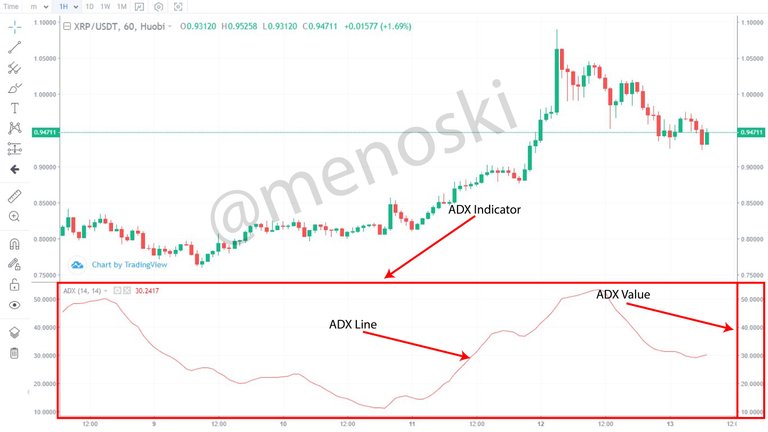
I hope you can clearly see how ADX indicator looks like. But how can we measure the strength of a trend from that(the chart above).
Quite simple, the ADX indicator has ADX values from 0 to 100. Where ever the ADX line is, indicates the strength of the trend.
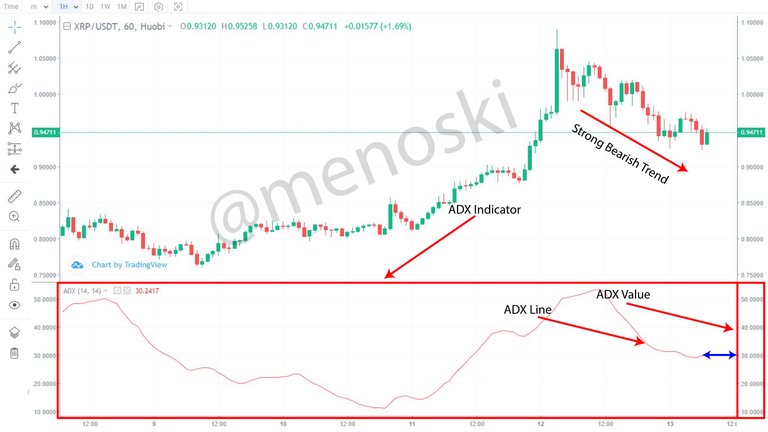
From the chart above, we can clearly see that ADX indicator is currently at 30, which indicates a strong bearish trend. Take a look at the image below for more understanding.
Okay, you can now clearly see how the ADX indicator line and value works. But how do we know that a trend is strong or weak? It is quite simple, ADX indicator has different range values which indicates the strength of a trend.
When ADX indicator is between 0 to 25, it indicates No Trend or Very Weak Trend.
When ADX indicator is between 25 to 50, it indicates Strong Trend.
When ADX indicator is between 50 to 75, it indicates Very Strong.
When ADX indicator is between 75 to 100, it indicates Extremely Strong Trend.
ADX is a component of Directional Movement System also known as Directional Movement Index (DMI). The DMI helps traders to determine the direction of the trend and when added to the ADX, it creates a clearer understanding of the chart's trend direction for a trader, as the trader will be able to get signal of which direction the trend is going using the DMI and crosscheck it with ADX, to measure the strength of the trend, which will lead to better decision making by traders.
The DMI comprises of two lines which are DI+ and DI- lines. This lines signals traders when there is a rise and fall in price, although, as a trader, you shouldn't strongly rely on this lines very well, as they often create false signals which may result to loss of funds for traders.
DI+ indicates uptrend, thus, whenever DI+ is above DI-, it indicates an uptrend price movement.
DI- indicates downtrend, thus, whenever DI- is above DI+, it indicates a downtrend price movement.
Take a look at the chart below for more understanding.
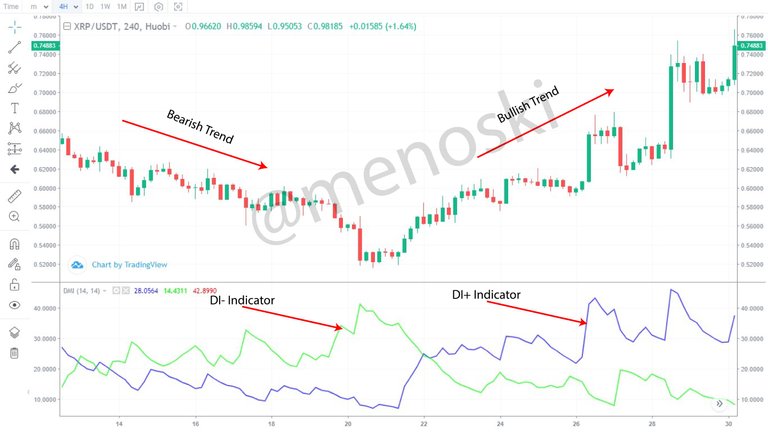
From the image above, the Blue Line is DI+ while the Green Line is DI-. As you can clearly see from the chart, when DI- was above DI+, the price was falling i.e downtrend price movement. And when DI+ was above DI-, the price was rising i.e uptrend price movement. I hope you now understand ADX and DMI indicators better now.
ADX Calculation
Below are the steps you take in calculating ADX;
- Step 1: You have to calculate DMI+ and DMI-.
DMI+ = Current Day High - Previous Day High

DMI- = Previous Day Low - Current Day Low
- Step 2: Calculate True Range
True Range (TR) = Max[(High – Low), (High – Previous Close), (Previous Close – Low)]
- Step 3: Calculate both the positive and negative Directional Indexes
+DI = ( +DM / TR ) * 100

-DI = ( -DM / TR ) * 100
- Step 4: Calculate Directional Difference and Sum
DIdiff = ((+DI) - (-DI))

DIsum = ((+DI) + (-DI))
- Step 5: Calculate Direction Movement Index (DX)
DX = ( DIdiff / DIsum ) * 100
- Final Step: Calculate ADX
ADX = Sum of n (DX)/ n
Illustration
Current High = 50
Previous High = 40
Current Low = 45
Previous Low = 40
Previous Close = 43
Number of Periods = 15
- Step 1
DMI+ = 50 - 40
= 10

DMI- = 40 - 45
= -5

:- DMI+ = 10 and DMI- = -5
- Step 2
TR = (50 - 45), (50 - 43), (43 - 45)

TR = 5, 7, -2

The True Range is 7
- Step 3
+DI = 10/7 * 100

= 142.87 = 143.

-DI = -5/7 *100

= 71.42 = -71

:- +DI = 143 and -DI = -71
- Step 4
DIdiff = ((143) - (-71))
= (143) + (71)
= 214

DIsum = ((143) + (-71))
DIsum = 143 - 71
= 72

:- DIdiff = 214 and DIsum = 72
- Step 5
DX = (214/72) * 100
DX = 2.97 *100
= 297
- Final Step
ADX = (297)/15

ADX = 19.8 = 20

ADX is 20, hence, no Trend, as it falls between 0 - 25
I hope you all found the article interesting and exciting. Do well to share your thoughts about the article in the comment section below. Thanks.