When Will Bear Market End? (October 7 2022)
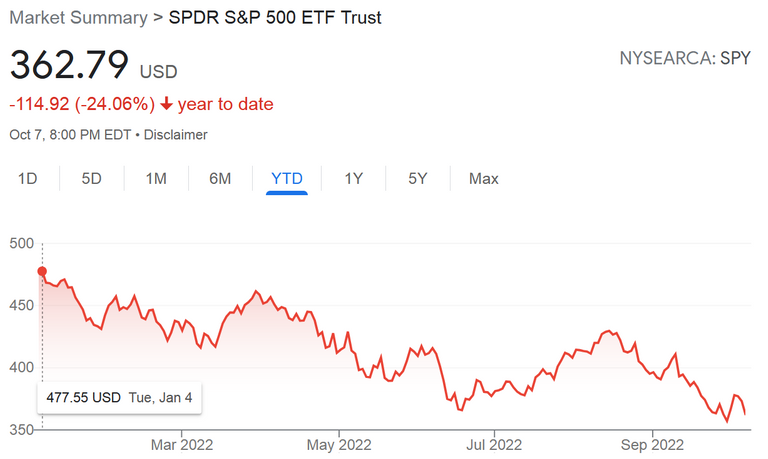
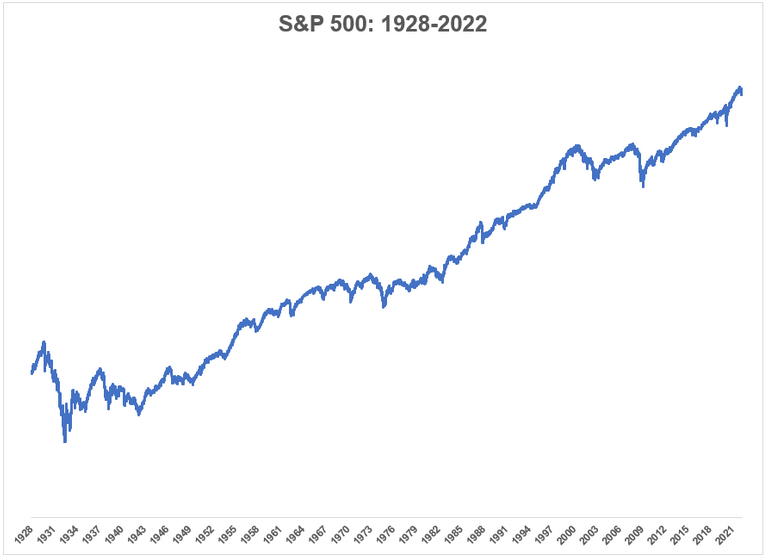
It has been difficult as of late to look at the stock markets for people who have money in it. To date 2022 all US major indexes have fallen more than 20% which quantifies current year as a bear market. Yet if we look at a bigger picture on average each year stocks gain around 9.8% annual over the span of over a 100 years.
(Courtesy of awealthofcommonsense.com)
So the million dollar question is when will the current stock market drop end? Over the years I have seen some patterns and numbers that has proven to show signs of market tops and bottoms. Today we look at some of these indicators and what they mean.
AAII Bear Sentiment
AAII Sentiment Survey was started in 1987 and is a survey for current investors in the market on what they expect in the upcoming six months of the stock market. The survey results come out every week and accumulated chart below:
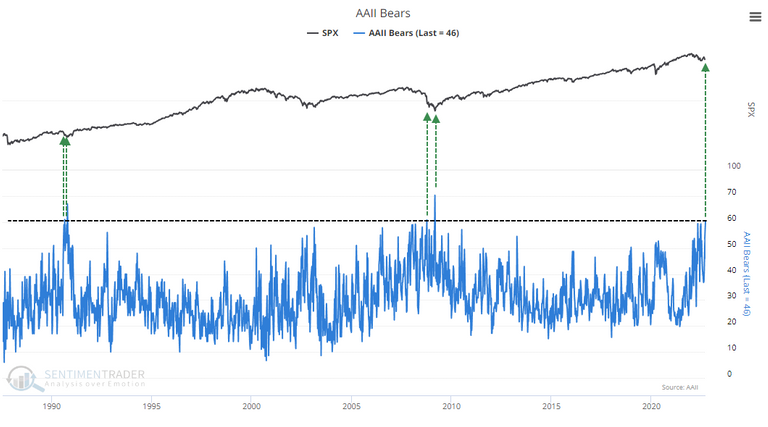
(Courtesy of Sentiment Trader)
The current survey has a rating of 60.9% of participants bearish for the upcoming six months in stocks. This is only lower than March 5, 2009 percentage. For those who are not aware during the Great Financial Crisis markets bottomed on March 9, 2009 which was a Monday and from there never looked back since.
The point here is AAII sentiment can reveal the excessive bearishness leading to potential reversals. With stocks dramatically down it is understandable that the sentiment is mostly bearish. However at extreme cases such as that of March 9, 2009 and may likely be of current 2022 it may appear markets are closer to a bottom than continuous price free fall.
NAAIM Exposure Index
Another survey correlating to market sentiment but based on fund manager's purchase or not purchase of the S&P is the NAAIM index. The lower the number and closer to zero means fund managers bearish on S&P and the higher the number that is close to 120 means fund managers bullish on S&P.
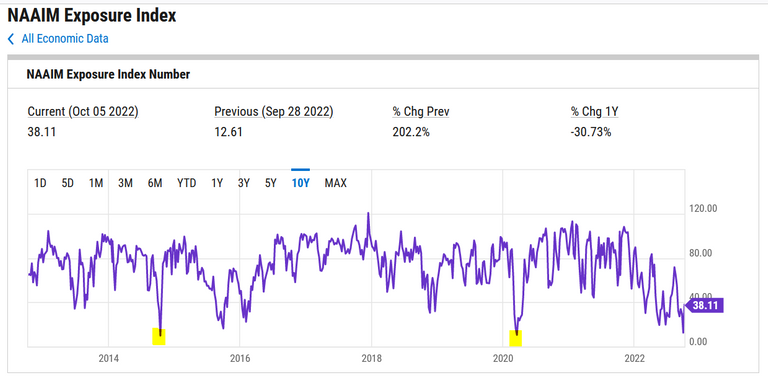
(Courtesy of ycharts.com)
Since its creation in early 2000 only a handful of times had the index drop below 10. In all those instances below 10 the S&P found a bottom. As of today the index hit a low of 12.16 for the year however today it closed at 38.11. We should keep an eye out on this number as it is updated weekly to see if it ever goes below 10 again. The potential of a market bottom maybe a a lot closer than we think with these sentiments.
Insiders Selling
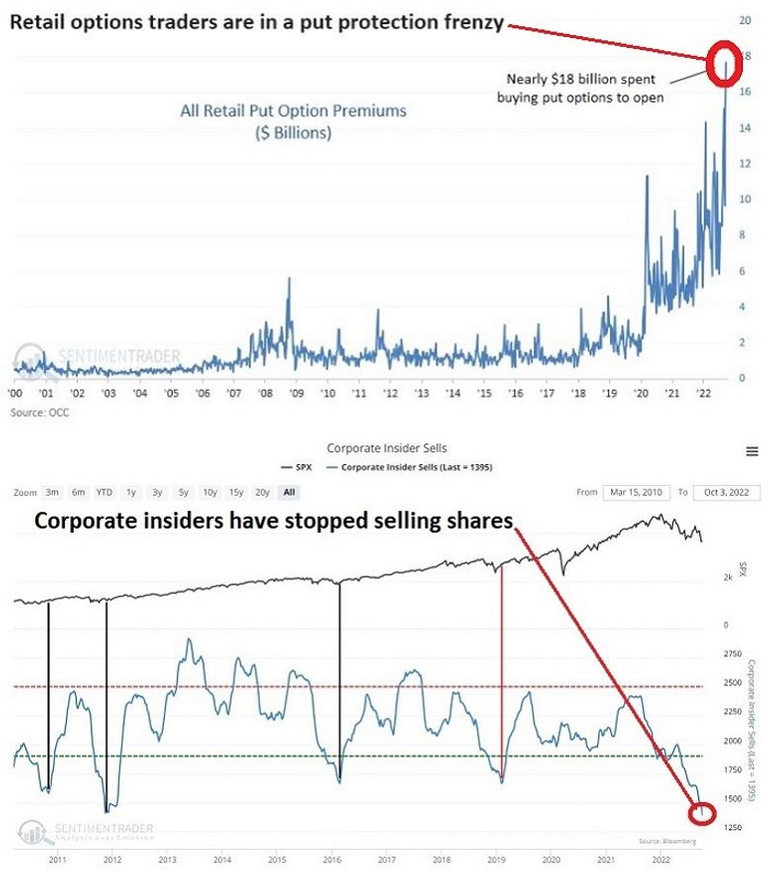
(Courtesy of Sentiment Trader)
Not often do we see insiders selling dwindling but as of late this is the case. With less selling pressure gone what would create a bullish case for stocks is traders who pick the opposite side of the trade. This is to say those who are betting on further stock decline are also at an excess high relative to past years. The sentiment being bearish and the rate of trades being bearish is out weighting the bulls. In the long run things will capitulate and prices will move the opposite of the majority which in turn create price squeezes and in this case prices to the upside.
Bear Markets Always Ends
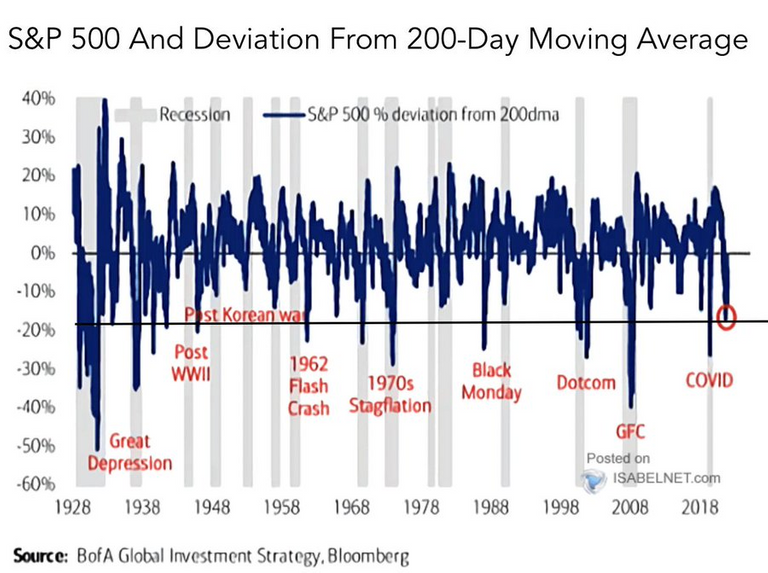
(Courtesy of Bank of America)
In every case where the stock market had fallen 20% or more there has been a bounce back and markets reaching to new all time highs. Lets take a look at a statistic from Carson:
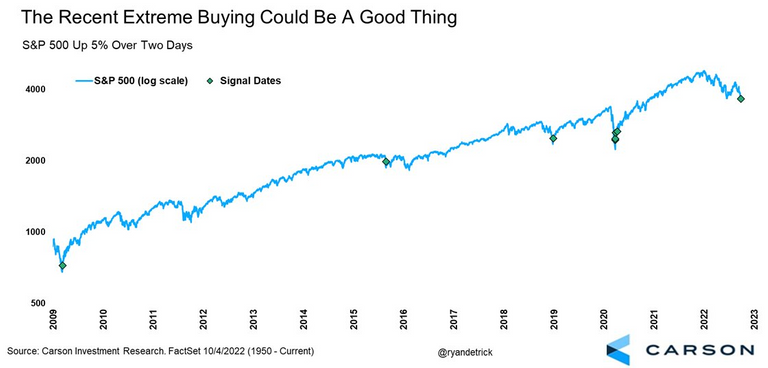
Fourth quarters of markets have a tendency to be strong. At the beginning of this week it was beginning of October and markets rose significantly in the first two days of the week. Of course we knew how that ended for the week however if we look at it on a longer time frame it appears the market is well on its way to potentially finding a bottom and have a solid recovery for the following year.
Bottom line is there is enough evidence for us to start watching the markets to see if a bottom in price will come soon. On days where there seems to be extreme selling and lower lows it maybe a sign of capitulation. It is worth noting past results do not mean future will be the same. Therefore although we looked at the multiple indicators shown in this post the reality is bears are still in control and if you are trying to buy the dip you have to be cautious.
None of what I write is financial advice. It is for entertainment purposes only. Thanks for reading!

LeoFinance = Financial Blog
LeoDex = Hive trading exchange for Secondary Tokens, Low 0.25% fees for deposits and withdraws.
HiveStats = Hive stats per user
LeoPedia = Informative content related to anything about Crypto and how to make financial gains in crypto!
CubDefi = LEO Finance's Defi with CUB Token
This post has been manually curated by @bhattg from Indiaunited community. Join us on our Discord Server.
Do you know that you can earn a passive income by delegating your Leo power to @india-leo account? We share 100 % of the curation rewards with the delegators.
Please contribute to the community by upvoting this comment and posts made by @indiaunited.
Congratulations, @mawit07 Your Post Got 100% Boost.
@mawit07 Burnt 122.396 UPME & We Followed That Lead.
Contact Us : CORE / VAULT Token Discord Channel
I agree that there is a need to watch. At least from what I have seen, I think there are lower levels for the stock market because it hasn't broken the downward trend yet.
!WINE
Posted Using LeoFinance Beta
Congratulations, @jfang003 You Successfully Shared 0.100 WINEX With @mawit07.
You Earned 0.100 WINEX As Curation Reward.
You Utilized 1/2 Successful Calls.
Contact Us : WINEX Token Discord Channel
WINEX Current Market Price : 0.210
Swap Your Hive <=> Swap.Hive With Industry Lowest Fee (0.1%) : Click This Link
Read Latest Updates Or Contact Us
Thanks. I always read these posts with smart. I am buying monthly.
I think we still have a way path long downward, maybe next year will shine some light again...
Posted Using LeoFinance Beta
Everything is in loss now, tough to predict anything.
this post is beautiful, I liked the graph of the S & P 500, I did not expect it to be substantially always uphill
Posted Using LeoFinance Beta