Let There Be Blood in the Markets... (05.06.20)
 Although middle of last week we have seen SPY hit near 295 it is currently bouncing off from a low around 280 and change. Yesterday and today's market at close of May 5th is showing that the down trend that started on Wednesday has been bought. Will the uptick continue?
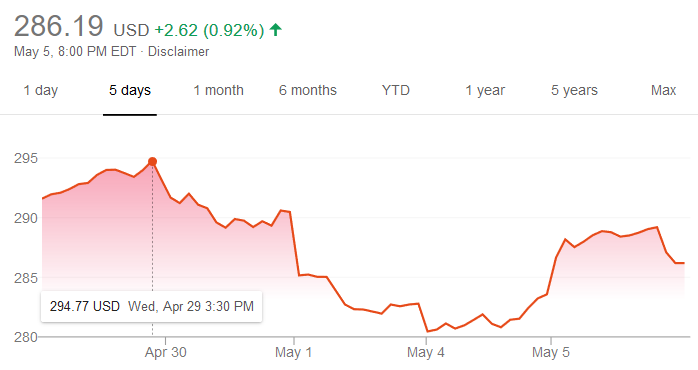
SPY hourly Chart

RSI is curving up while MACD is slopping down but slowing and trying to settle. SPY price again bottom around Monday morning and have since been off to the races. From this chart SPY looks bullish.
SPY 4 hours Chart
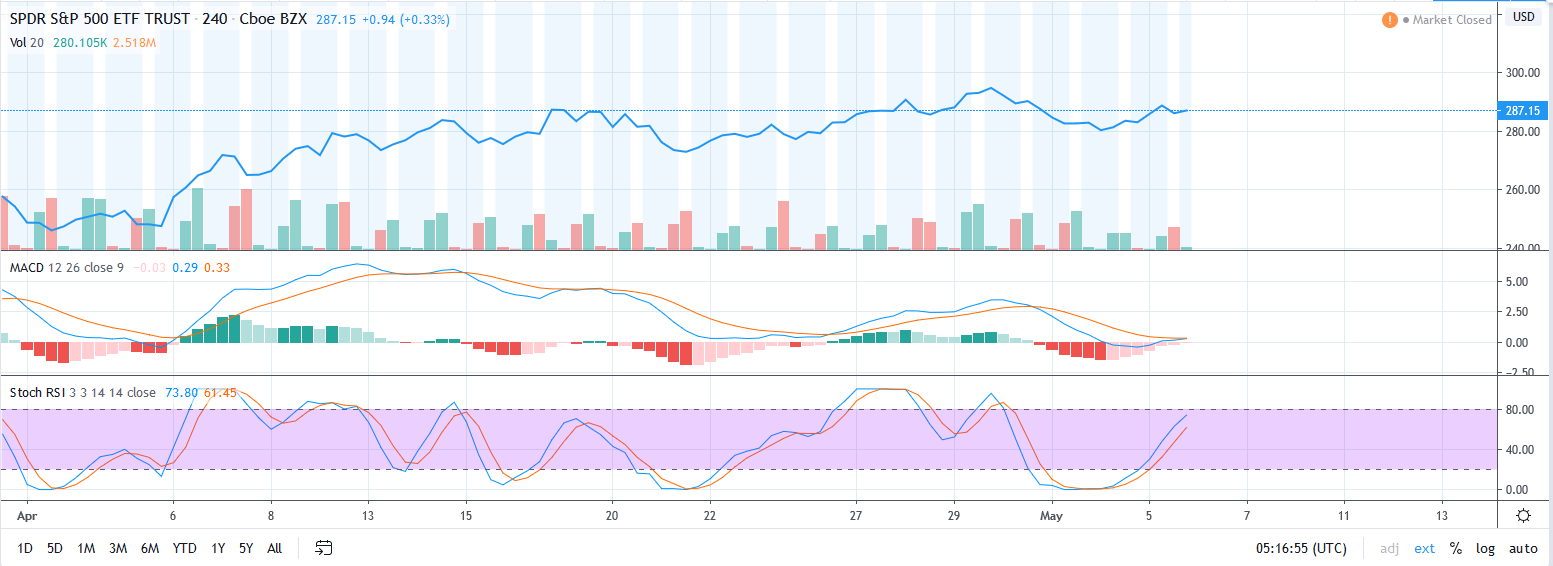
RSI is continuing to rise while MACD is neutral but within a downtrend. Price on SPY still looks bullish but definitely weakening based on MACD sloping down.
What's the Plan?
I prefer to setup a short on SPY but will wait to see if it can retake 289/290 resistance. If it does there is potential for it to get back to 295. On the other hand with price diverging from MACD and RSI nearing a peak prices could fail at 289 and I will be looking to short around 288 break down for confirmation. The support would be at 280. I would not go long since Thursday we have new unemployment numbers and Friday April's % unemployment. I do think those numbers will sway the market either way.
If markets get in a range not above 289 but also not a definitive drop below 285 we could be expecting a massive move towards the jobs numbers. However if I am already in my short trade going into the jobs numbers I will see now sentiment goes and decide then if I hold through the numbers or close.
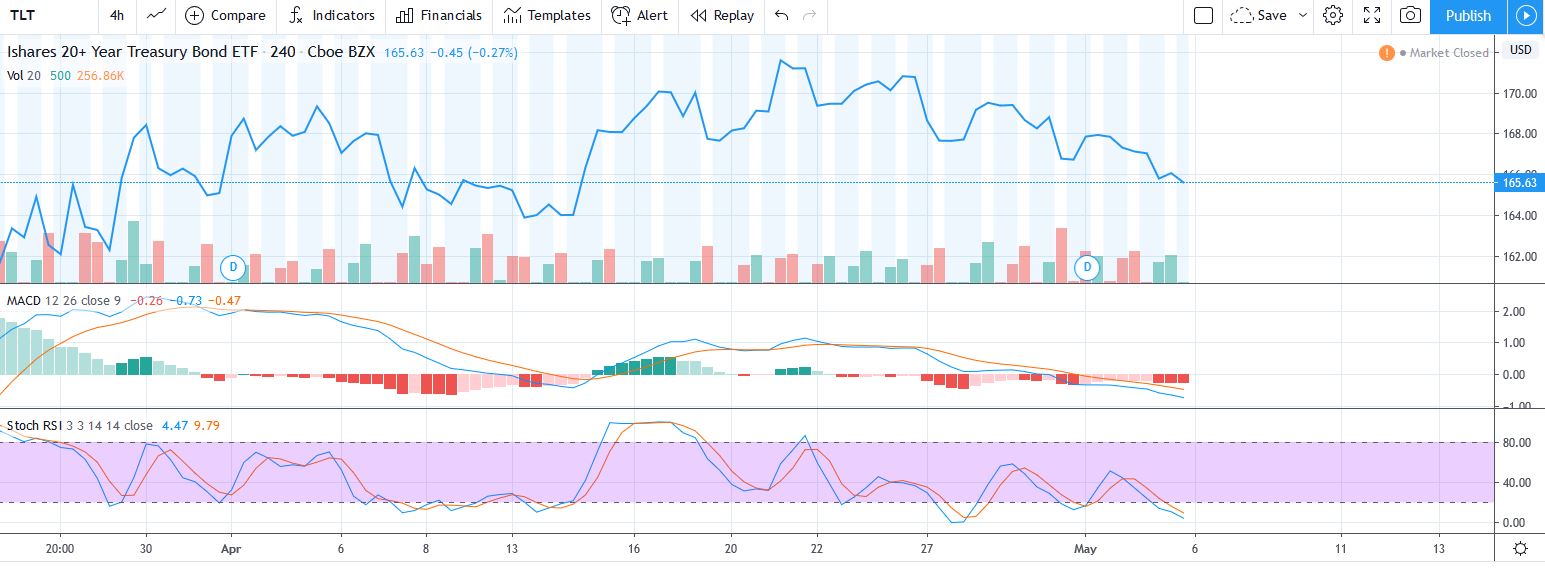
Another sentiment reading I am looking closely is US bond seem to be rolling over. TLT is within a tight range but MACD and RSI are dramatically weaker than where it reach its high in March. A short term bounce is possible in chart below but on longer time frame TLT is weak. Personally I see shorting bonds is easier than shorting the SPY base on the techs I see. So moving forward if TLT indeed bounces and SPY drops the short on SPY I may have on may be short lived depending on how bonds do. 166 looks to be a failing point but some support at 162/163. If 162/163 breaks to the downside I would be heavily short TLT as the move down could be at least to 155 or even 145.
Disclaimer:
I am not a financial advisor and all this post information is for entertainment purposes only.
Posted Using LeoFinance
Looks like some interesting spread play potential short term on both slightly out of the money call spreads and slightly in the money put spreads
For the last month SPY is within a 20 point range 270-290. Compression in price means a big move coming. Short term trades a great for these kind of setup when outcome of range is confirmed. I am leaning bearish since techs are making lower highs and lower lows.
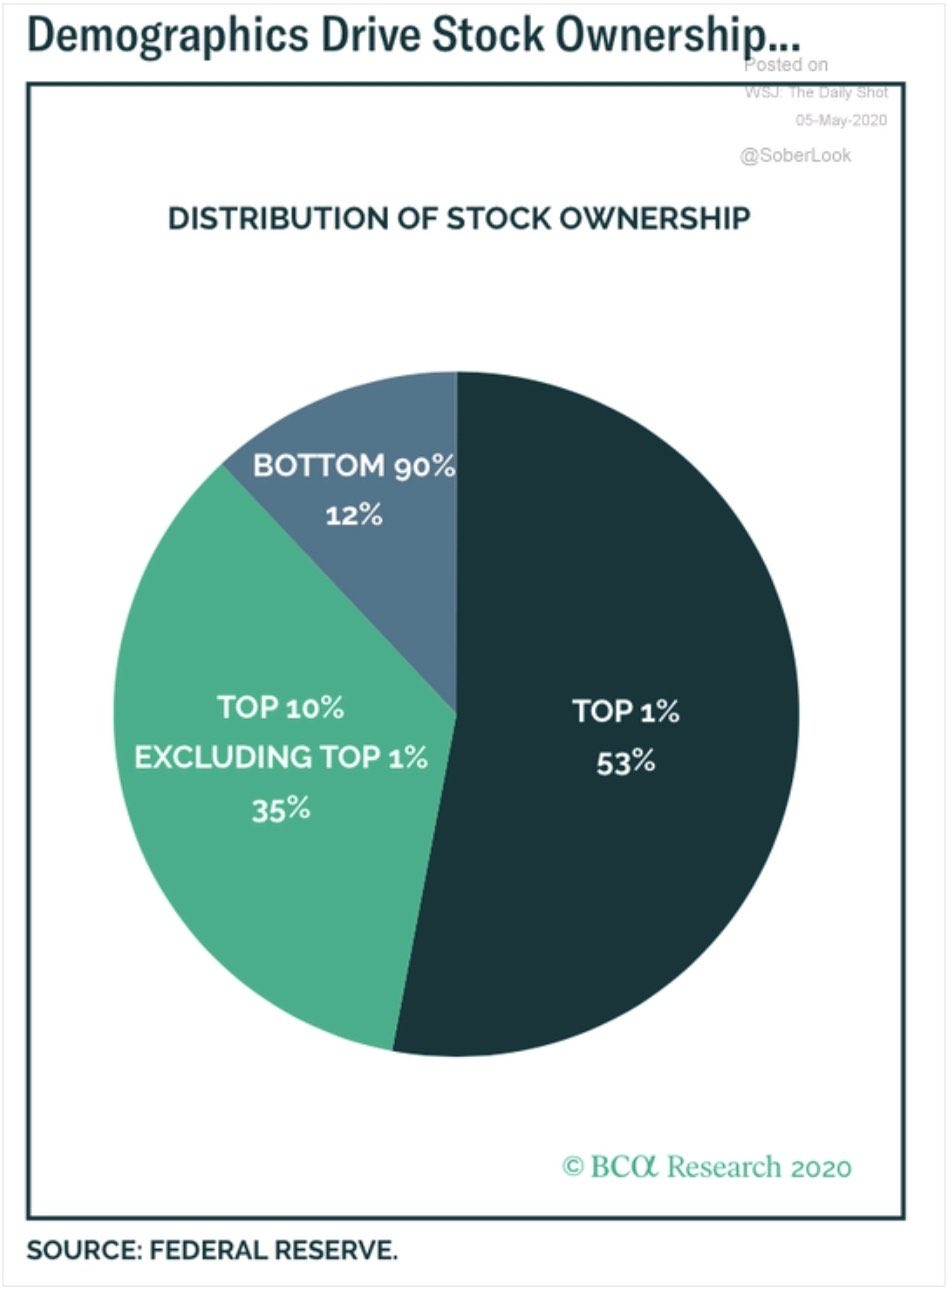
The value of the stock market is no longer correlated to the economic system.
It is being bought by the FED to keep it from crashing https://markets.businessinsider.com/news/stocks/why-stock-market-soaring-amid-recession-signals-fed-coronavirus-stimulus-2020-4-1029104715
When 85% + of stocks that have been created are owned by 10% of the population it is basically game over, the 90% of people at the bottom are no longer buying because they do not have enough money to buy. Most of the 10% at the top know that and they are not selling because they know if they start selling there is no one there to buy and prices will just plummet. And the people who are selling the FED will just print money to buy those stocks to keep the prices from falling.
We are just going to see stagnation for the next 20+ years, similar to what happened with the Japanese stock market.
The bright side to this is US population average age is younger compare to Asian countries. One would hope the recovery will happen sooner with a younger workforce
Excellent writing. Added you to my autovoting list on both chains.
Best of Luck!