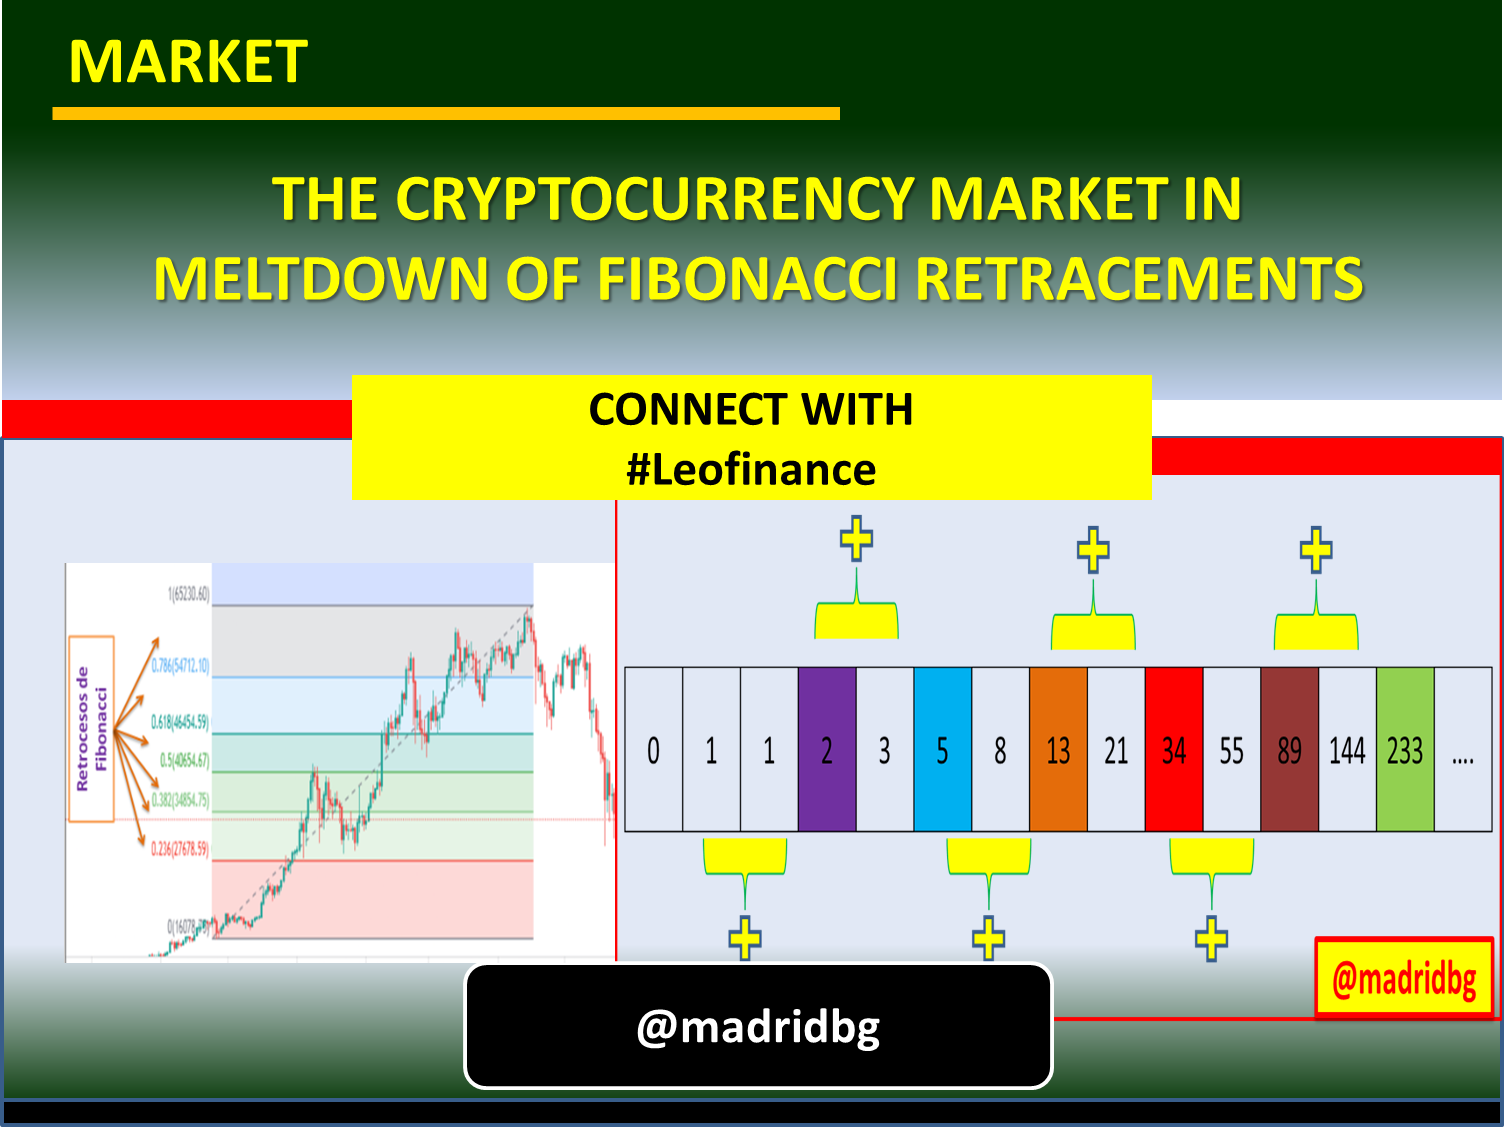
THE CRYPTOCURRENCY MARKET IN MELTDOWN OF FIBONACCI RETRACEMENTS
Author: @madridbg, through Power Point 2010, using public domain images. Mediamodifier
Greetings and welcome dear readers of this prestigious platform and especially to all those members who are passionate about technical analysis applied to the cryptographic world and who live daily in the @Leofinance community.
The subject that concerns us in this installment is associated with the implementation and understanding of Fibonacci retracements as a commercial strategy that allows us to carry out operations in the market.
In this sense, it is necessary to highlight that setbacks are nothing more than reversals made by the price in certain periods of time, due to the undulating movement generated by the supply and demand of the price. active, in such a way that the points of the largest number of surrounding operations are determined by the Fibonacci retracements and that we can use as much more precise support and resistance zones, both in bullish and bearish markets.
The emergence of this indicator is attributed to Leonardo Fibonacci, an Italian mathematician who introduced these fundamentals in the 13th century and that we have used in the compression of the price of an asset in the market.
At the level of methodological understanding and its use in the crypto asset chart, Fibonacci retracements are presented as horizontal lines that, as we mentioned, serve as support and resistance based on the percentage bases established by Leonardo Fibonacci, among which levels ranging from 23.6%, 38.2%, 61.8% and 78.6% stand out, although at present the value of 50% is usually included as part of the setbacks without this being one of them.
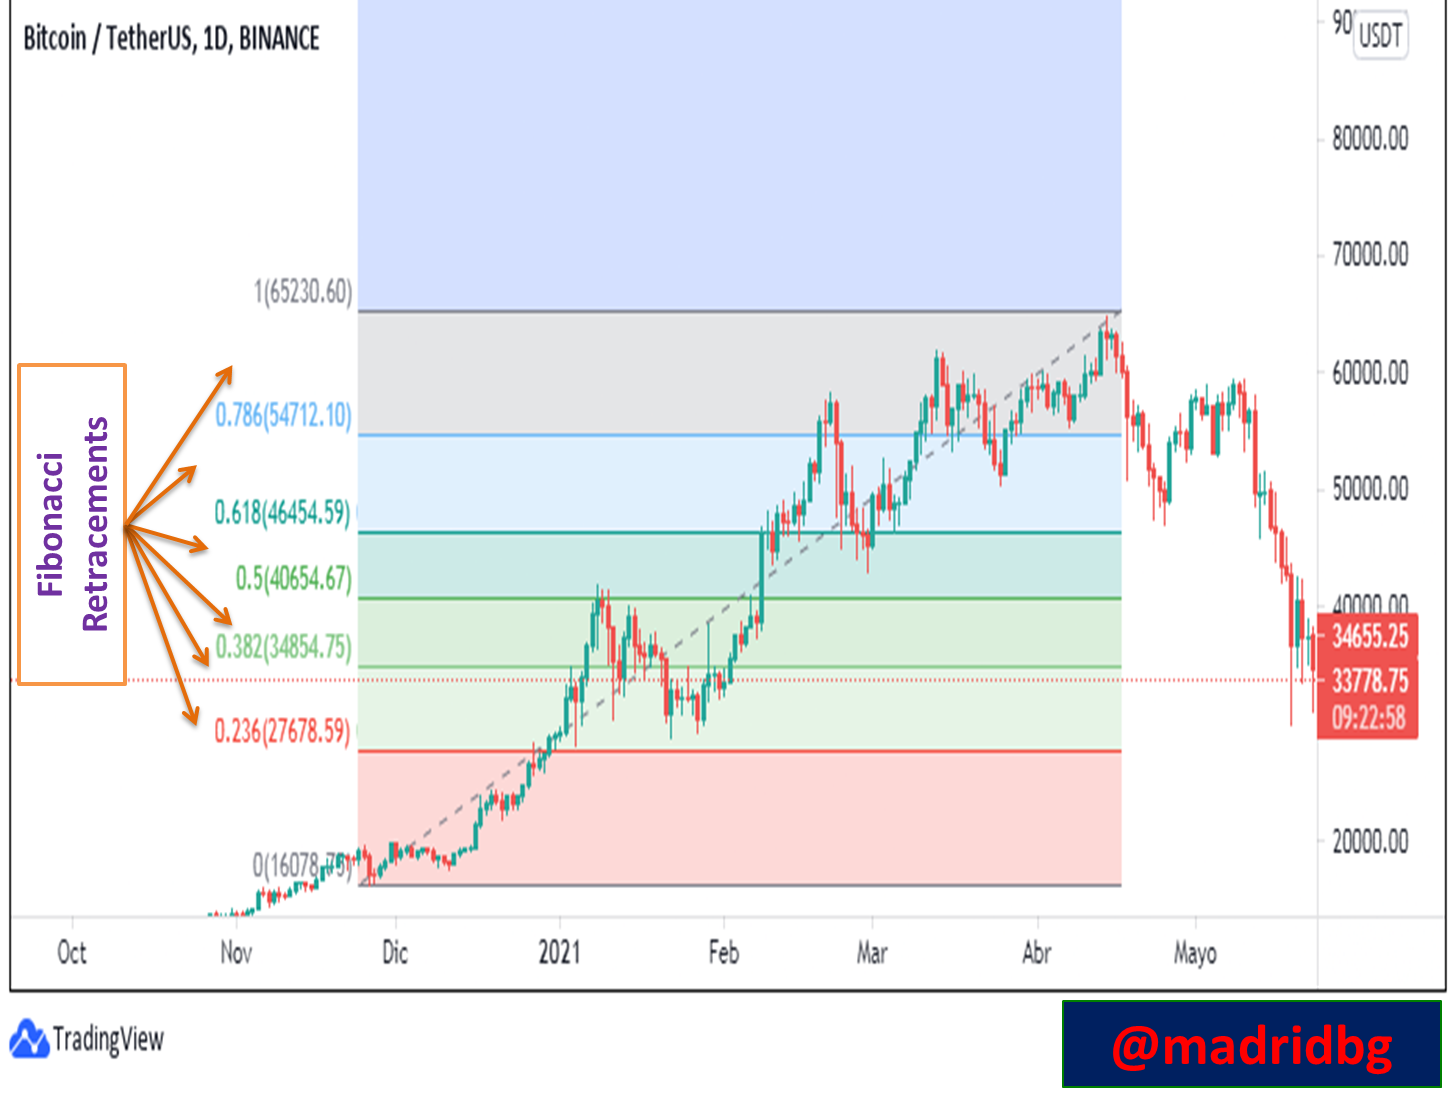
Screenshot taken by @madridbg through the tradingview portal. tradingview
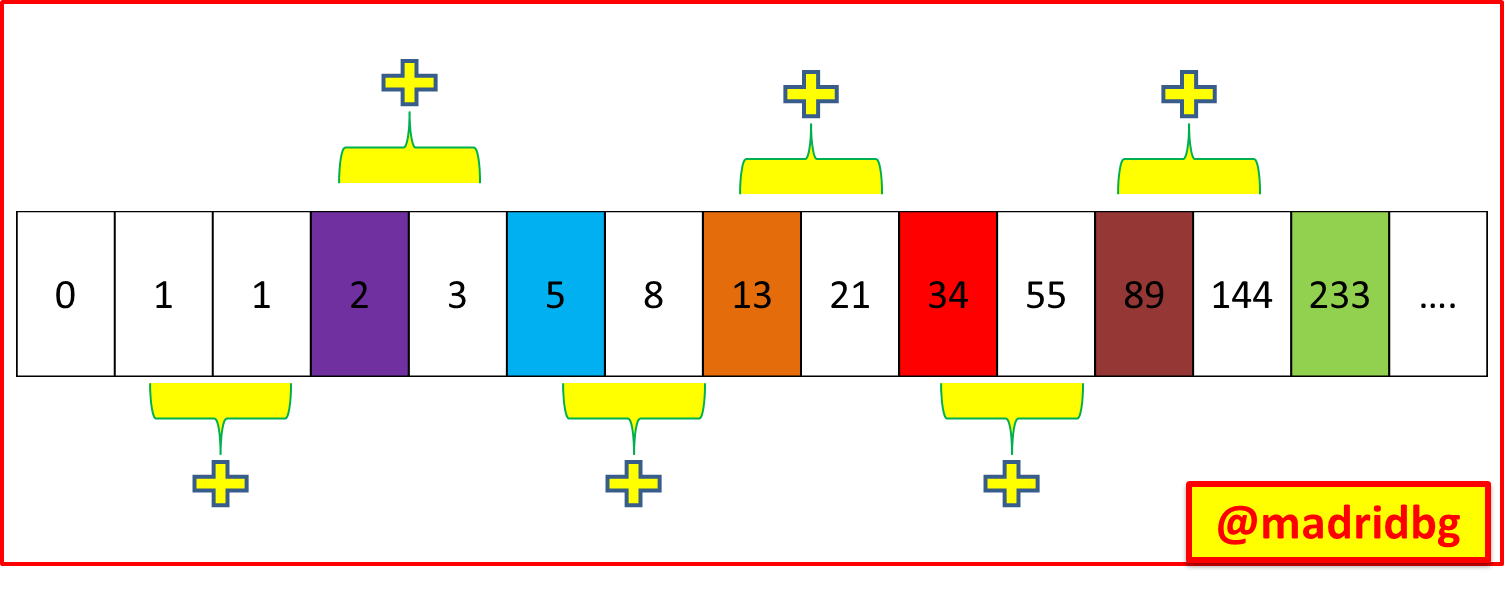
Although it is true that in the different platforms used for technical analysis, the indicators are loaded with mathematical and statistical procedures automatically, it is never too much to know the nature of the data and in this sense, we will show the numerical sequence implemented by Fibonacci, the which was based on repetitive summation of the previous numbers as represented in the following image.
As operators or trader, we must base ourselves on the conceptual knowledge and practical experience that we can acquire in the market, personally I am in favor of the second being the one that actually allows us to be profitable over time in this world where volatility it is one of the variables associated to a certain extent with the success or failure of our operations.
Starting from the above, let's learn how to trace the setbacks, for this it is essential to identify and understand the trend that the price follows, in such a way that we observe the following graph and we will be able to notice that the sequence of the price action is bullish, so we draw an extension of the indicator from a low point to the highest point of the price, in other words, we must extend the indicator in its entirety, in correspondence with the different percentage values it assumes.
Hence, where the horizontal lines are generated, they are areas considered as support and resistance and we will make our speculations in relation to these.
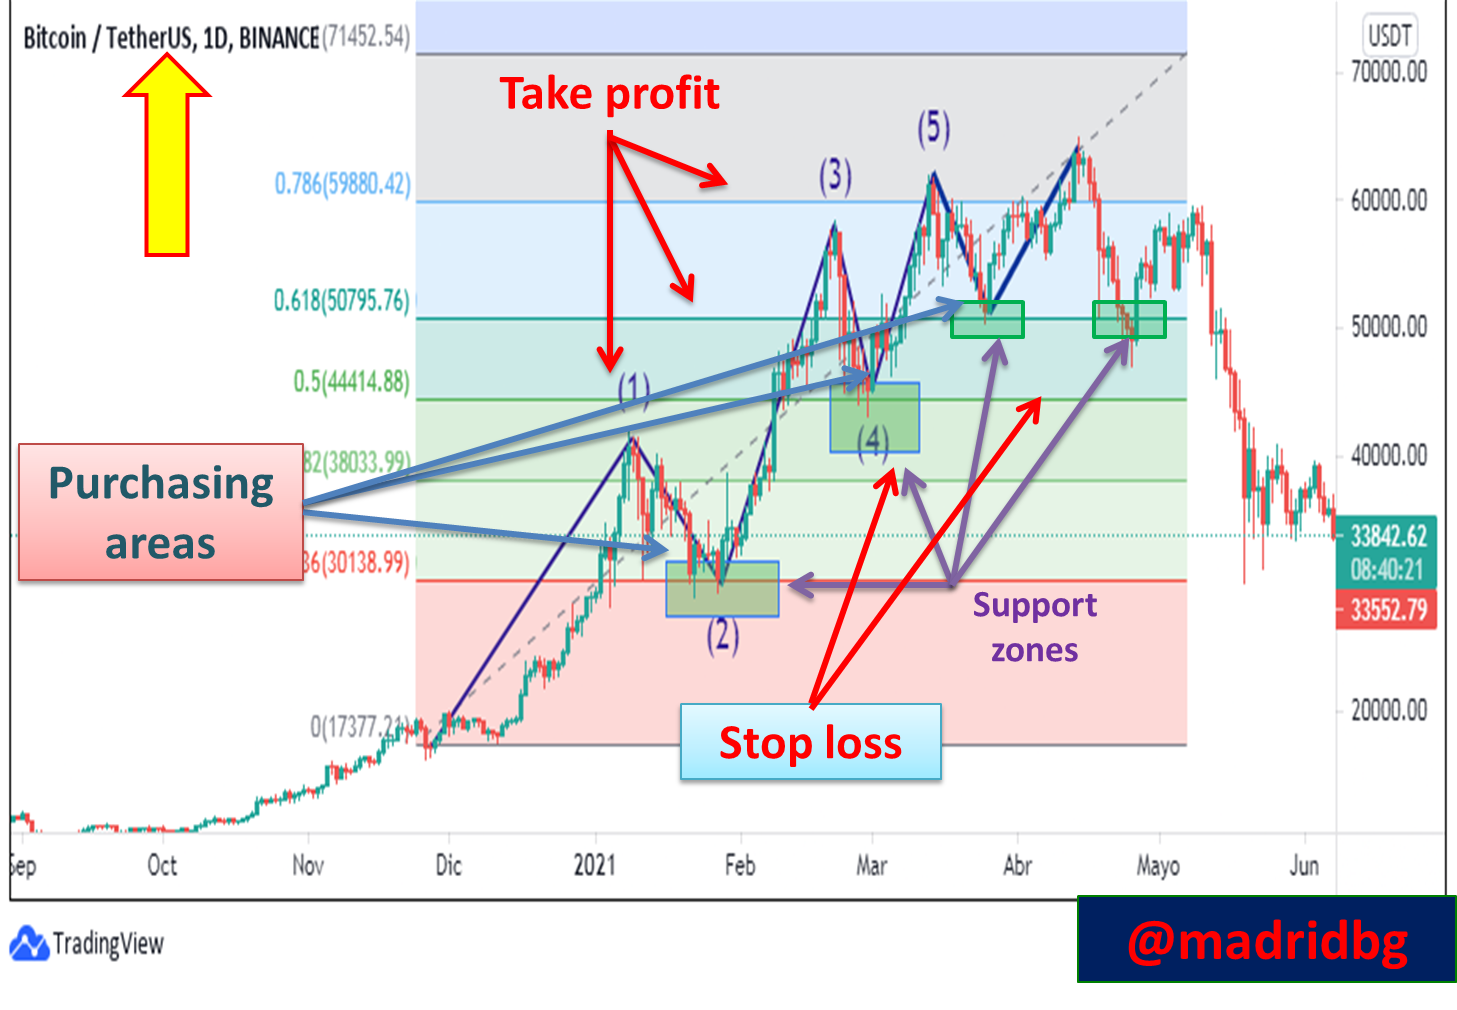
Screenshot taken by @madridbg through the tradingview portal. tradingview
Let's look at the previous graph, as you will see we have identified a clear upward trend since the highs generated (patterns 1, 3, 5) are higher than the previous ones, as well as the setbacks generated by the price (patterns 2, 4, 6), In this sense, having the Fibonacci lines clear, we can use them as buying zones, setting our stop loss at a point before the Fibonacci used buying, using a 1:1 risk-reward ratio, an aspect that we can also consider for markets in bearish trends.
In such a way, I hope this information will be useful to you, that we will be able to put it into practice through demo accounts and thus evaluate the profitability and efficiency of the indicator.

BIBLIOGRAPHICAL REFERENCES CONSULTED
[1] Fibonacci Retracements. Article: Online Access
OF INTEREST

0
0
0.000
#posh twitter:
https://twitter.com/BGMadrid/status/1485455325612412928?s=20
https://twitter.com/BGMadrid/status/1485455325612412928
The rewards earned on this comment will go directly to the person sharing the post on Twitter as long as they are registered with @poshtoken. Sign up at https://hiveposh.com.
Congratulations @madridbg! You have completed the following achievement on the Hive blockchain and have been rewarded with new badge(s):
Your next target is to reach 90000 upvotes.
You can view your badges on your board and compare yourself to others in the Ranking
If you no longer want to receive notifications, reply to this comment with the word
STOPCheck out the last post from @hivebuzz:
Support the HiveBuzz project. Vote for our proposal!