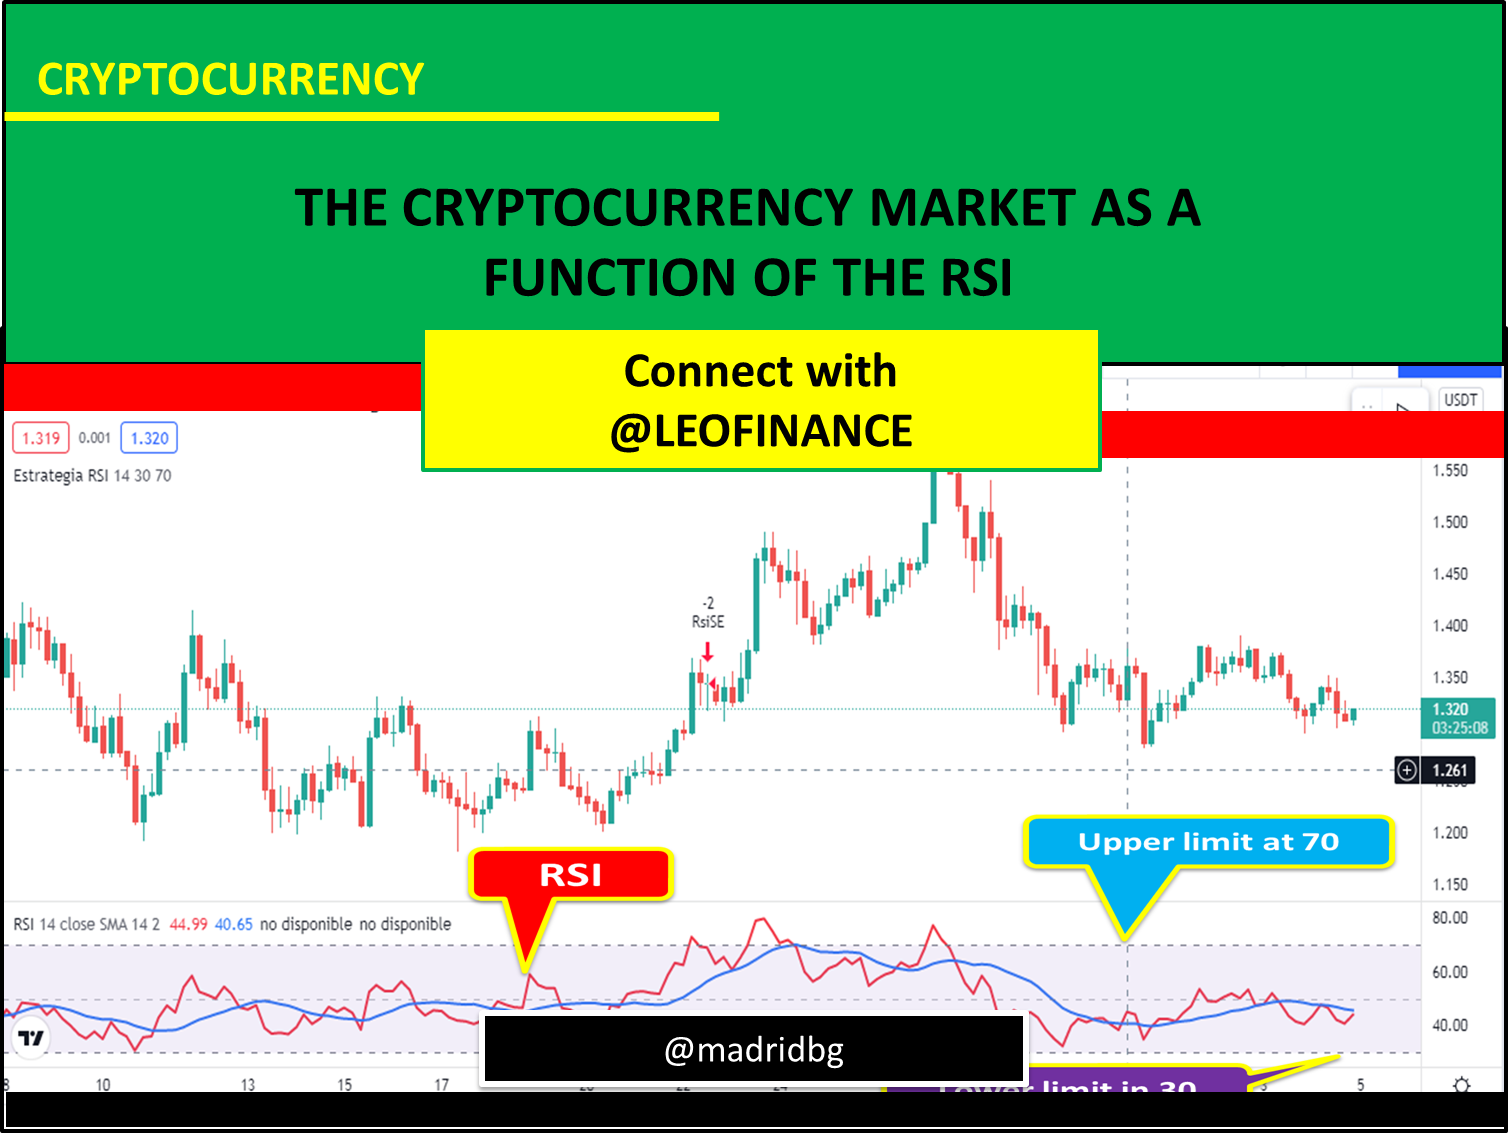
THE CRYPTOCURRENCY MARKET AS A FUNCTION OF THE RSI
Author: @madridbg, through Power Point 2010, using public domain images. Pexels
Greetings and welcome dear readers of this prestigious platform, the issue that concerns us this time is related to the market approach, using the conceptual and practical utilities of the RSI as a basis.
In this sense, it is necessary to understand that the use of indicators in our technical analysis allows us to speculate on the price action of an asset in general, so that we can understand the possible movements in the future that generates the price of the same.
Therefore, the relative strength indicator (RSI) is presented as an analysis tool based on market strength, that is, it behaves like an oscillator that moves according to price action, hence its use has diversified, making it one of the most widely used indicators today.
Its creation is attributed J. Welles Wilder in 1978, who was based on a channel of movement that goes from 0 to 100, where it creates a sub-channel that moves between 30 for zones for overselling and 70 for overselling areas.
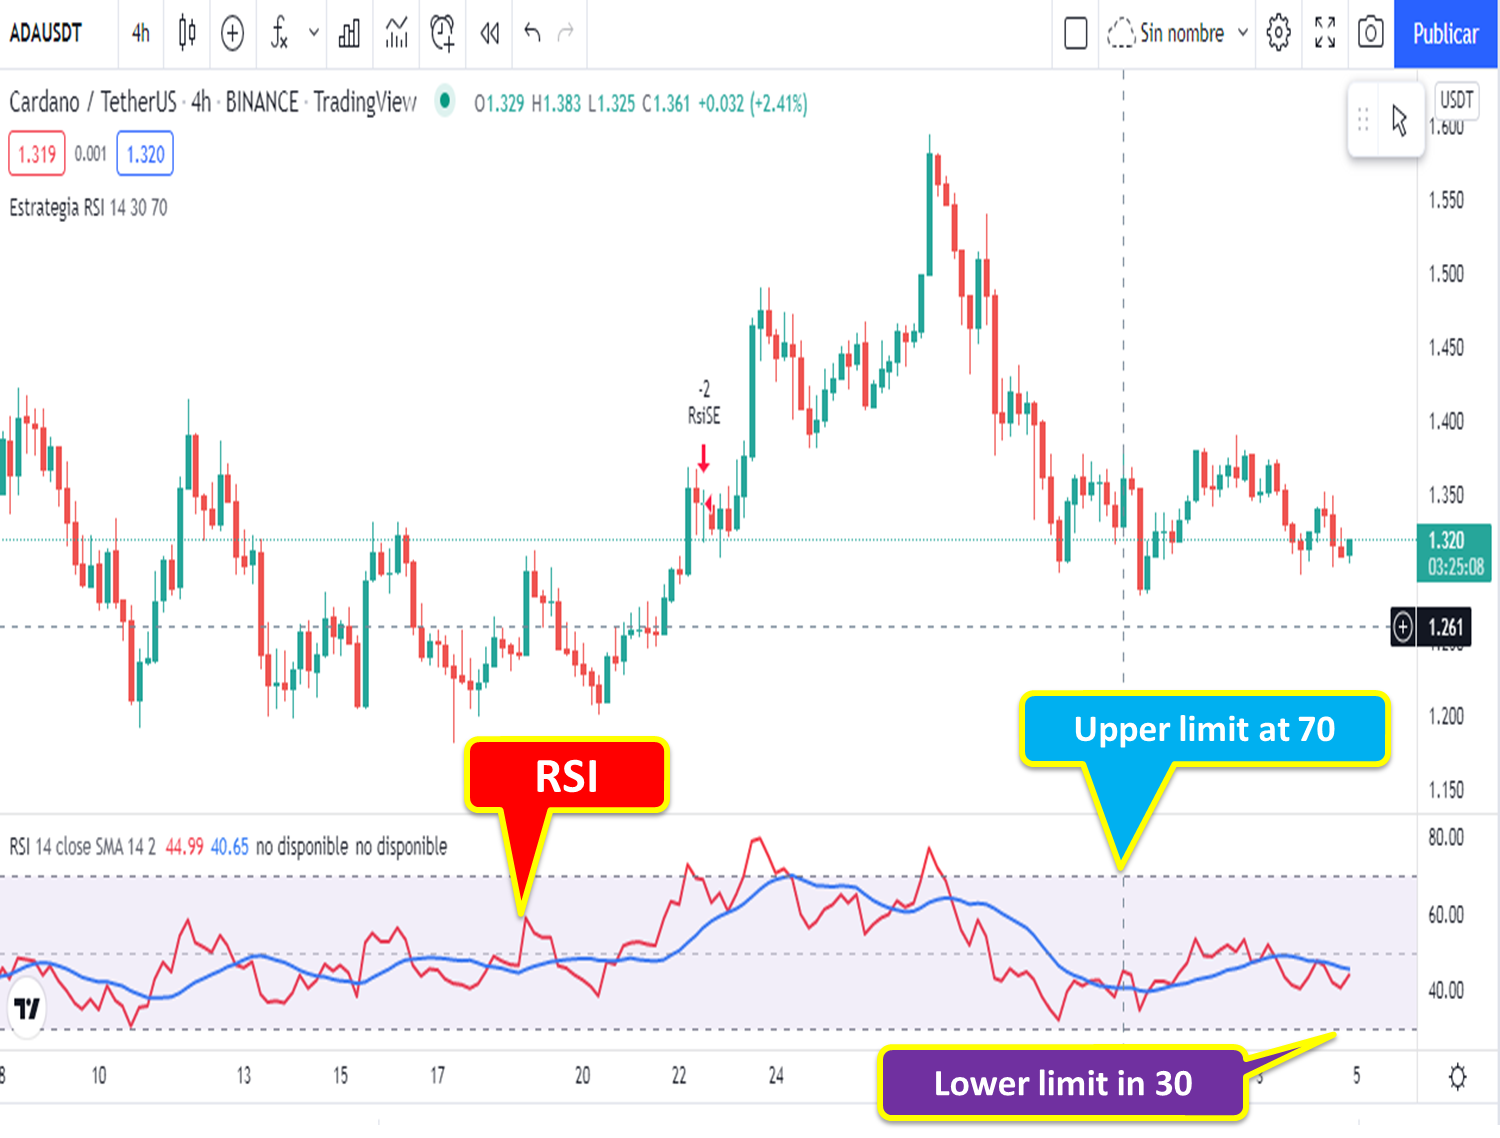
Fig. 3. Screenshot of MATIC/USDT pair in 1 day timeframe. Author: tradingview
From the point of view of the profitability that it offers, we must be clear that no known indicator represents the absolute truth of the price action and the RSI does not escape this reality, hence, the fundamental thing is to combine it with other indicators in search of of confirmations, the ideal in any commercial strategy is to be able to know the strength, direction, volume and timing of the market, which generates a holistic vision of it and of this we will be able to carry out better and more effective operations.
Adding the indicator to the chart is quite simple, due to how intuitive the tradingview platform tends to be, hence we will ignore this aspect, what we will do is identify possible buy orders and sale according to the behavior adopted by the indicator based on price variations.
Therefore, we will not make modifications to the indicator parameters, but we work with the default values, so that the analysis criteria are simple, just look at the graph and see in what Channel level you will find the price of the asset and work accordingly.
In other words, we will assume the buy zones, when we observe that the price of an asset is over-undervalued or oversold, so it is possible that the price is about to correct upward. , where we will make the entry once the price returns to the lower channel of 30, as seen in the following image for pattern 1.
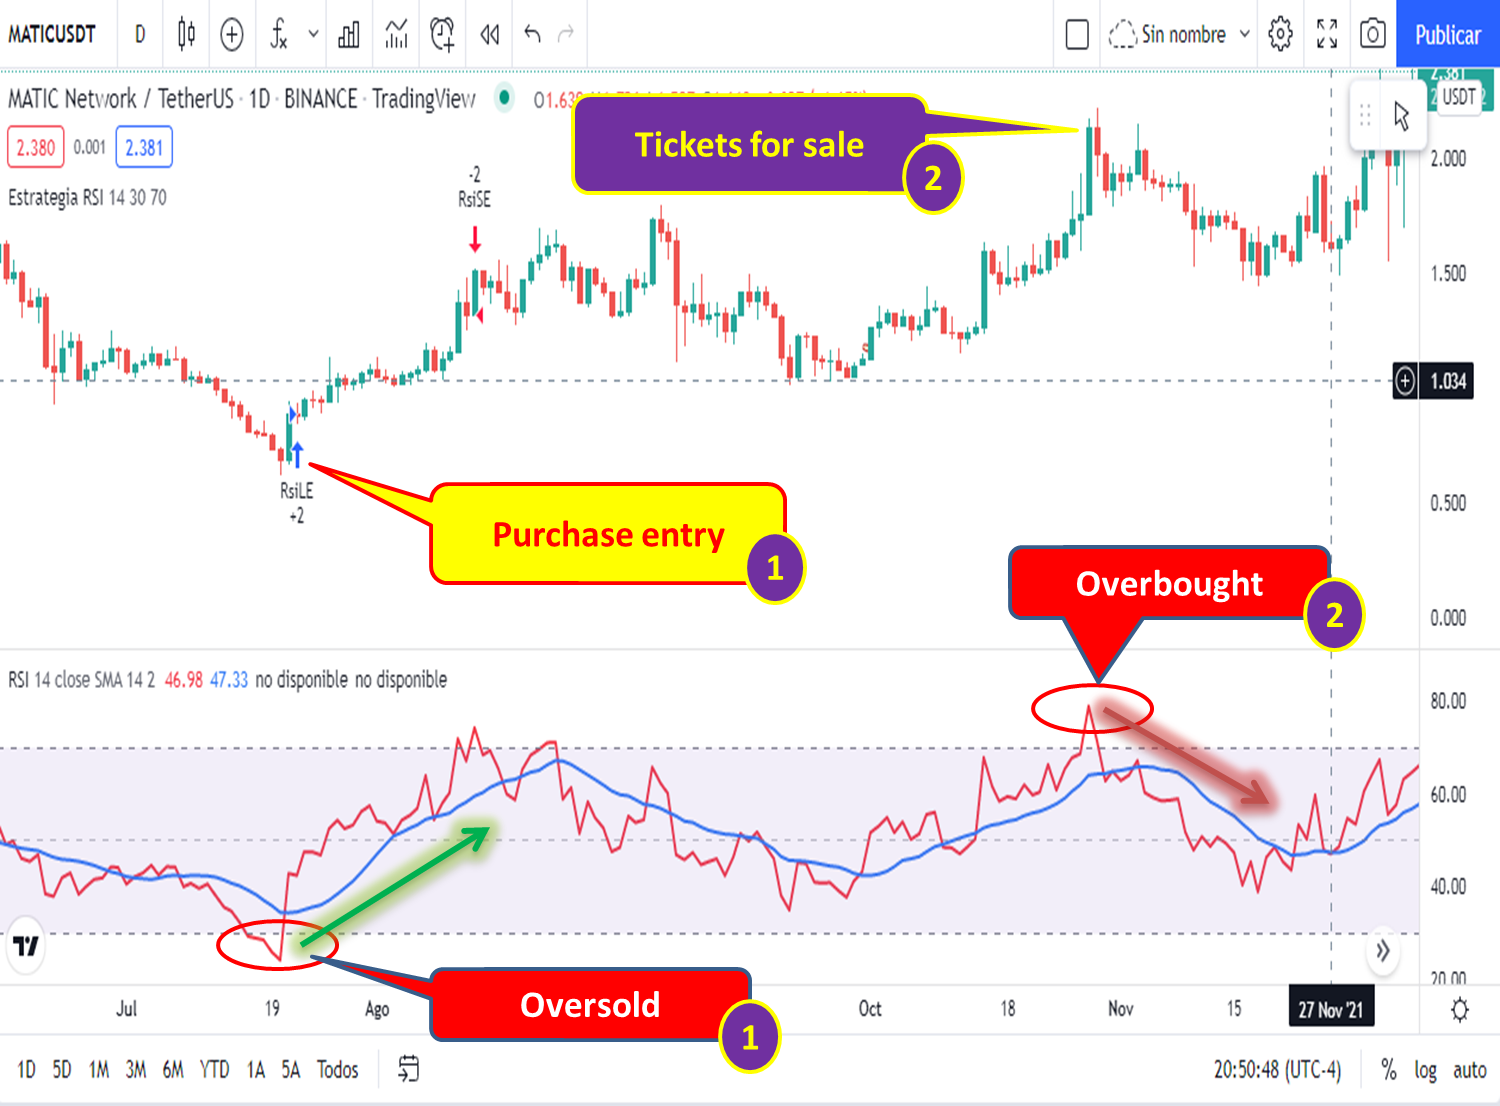
Fig. 3. Screenshot of MATIC/USDT pair in 1 day timeframe. Author: tradingview
For its part, we will assume the sale zones when the price is overbought, in such a way that the buying pressure may decrease and the asset price is speculated downward, as seen in the previous graph for pattern 2, At this point we will make our entry or exit from the market when the price returns to the upper level of 70.
In this sense, either up or down, RSI patterns are signals that should be tested in demo accounts to evaluate their profitability, I hope socialized information is useful for you.

OF INTEREST

0
0
0.000
#posh twitter
https://twitter.com/BGMadrid/status/1478588543815585796?s=20
https://twitter.com/BGMadrid/status/1478588543815585796
The rewards earned on this comment will go directly to the person sharing the post on Twitter as long as they are registered with @poshtoken. Sign up at https://hiveposh.com.