POINT BISERIAL CORRELATION ANALYSIS IN SPSS
Point biserial correlation analysis in SPSS is a relationship test between a continuous variable and a binary variable. In order words if your variables in consideration are of continuous nature including a binary variable. The preferable test for analysis is the point biserial correlation test.
A binary variable is a variable with two categories or sub samples. Example gender can be categorized into male and female. E.t.c variables of such nature are refered to as binary variables.
They are also called dichotomous variables as they are used to indicate the presence of a particular characteristics e.g affected or not affected, included or not included, satisfied or not satisfied can be all called dichotomous variable in point biserial correlation.
There is a principle guiding creation of binary variables are as follows.
Binary variables are not to be created from continuous variables such as variables that indicate a measured quantity as it may result into error.
Binary variables are not to be represented fom ordinal variables or variables with rank because they are more detailed with variance.
For relationship for continuous data, use Pearson bivariate correlation analysis.
For ordinal data, use spearman correlation.
For binary variables or dichotomous variables and a continuous variable, use point biserial correlation.
Correlation Analysis Interpretation
Correlation analysis test get interpreted with ease when considering Pearson Coefficient of correlation.
The value rangines from negative 1 to 0 and then to positive 1.
Better written as;
-1___________0__________+1
For:
Coefficient towards the range of +1
It is called positive correlation which indicates increase in one variable will lead to an increase in the other variable. Hence the direction of relationship is positive and has a positive sign (+).
Examples of such correlation is the ages of first and second child given birth in a space of one month interval in a family.
As the age of the first child increase with time, likewise the age of the second child.
This indicates there is a positive correlation or the correlation tends towards positive one.
Coefficient towards the range of -1
Coefficient of relationship that tends towards negative one entails that an increase in one variable will lead to a decrease in another variable that are related in a process.
It is the opposite of positive correlation.
Coefficient towards the range of 0
Coefficient towards the range of 0 indicates the presence of little or no relationship among variables in consideration.
Example of such relationship is the number of people going to work on a street and the number of birds that flies in the sky.
Not moving far way from the topic of consideration which is point biserial correlation analysis in SPSS.
I shall briefly look at examples of questions that can be answered with the point biserial correlation analysis.
Considering citizens living in Akwaibom state, is the length of thier life dependent on the type of gender?
The funny part of Statistical analysis is that it can be used to answer any type of question.
As a researcher, I want to find out if female lives longer than male or male lives longer than female in Akwaibom state.
The analysis will depend heavily on the death records of citizens in Akwaibom state before I can find an answer to the research question.
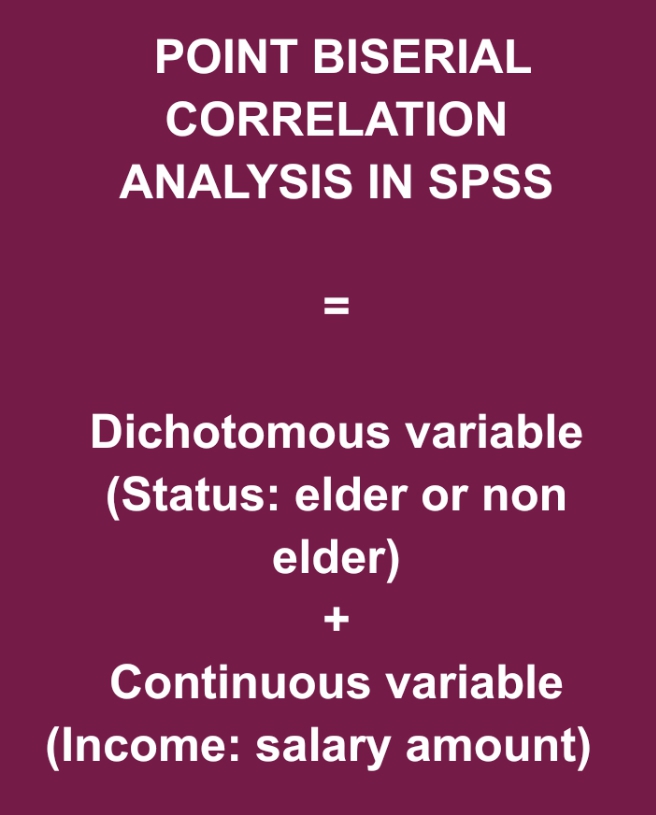
In the society, Are elderly people wealthier?
This is a typical question that can be answered by point biserial correlation analysis.
It finds if status of people (elderly or not elderly) are rich when thier income is considered.
In this analysis I have to seek permission from people the society in order to give them a questionnaire to enable them choose the class which they belong. The questionaire may not only contain the two questions alone but other related ones.
Can suceess or failure in an exam be influenced by a student score in English or mathematics?
How to conduct a point biserial correlation analysis in SPSS
Point biserial Correlation in SPSS doesn't have a special command. It is advisable to first check for relationship between the dichotomous and continuous variable. Which is to draw the scatter diagram of both variables first.
The scatter plot is used to visualize vthe direction of relationship between both variables. Having the scale variable on the y axis and dichotomous variable represented on the x axis.
To select the box plot,
Click on graph
Select chart builder and
Click on simple box plot.
The box plot displays the distribution of information of a variable in quartiles of data.
To check for point biserial correlation,
Click on analyze
Select correlate
Click on bivariate
Add both variables to the variable box.
Ensure you tick the box for Pearson correlation as well as select flag significant correlation.
Null hypothesis for correlation analysis
The null hypothesis for correlation analysis states that there is no relationship between the variables in consideration.
Ho = no relationship among variables in consideration
H1= there is a relationship and variables are independent in nature.
Conclusion
This guide has been able to give an insight concerning point biserial correlation analysis and how to go about such research question when it arises. Comments, suggestions and questions as regards should be indicated in the comments section.