Descriptive Analysis of BITCOIN Price
This article summarizes a descriptive report of BITCOIN’s price from October – November 5, 2022.
It shall be considered under the following subtitles;
Line graph And bar chart for BITCOIN price for the stated period.
Box Plot of BITCOIN’s price
Maximum And minimum price of BITCOIN.
Data view and Variable view of Analysis
Conclusion
Line graph for BITCOIN price for the stated period
The line graph for the price of BITCOIN from October 1st – November 5 is been shown below.
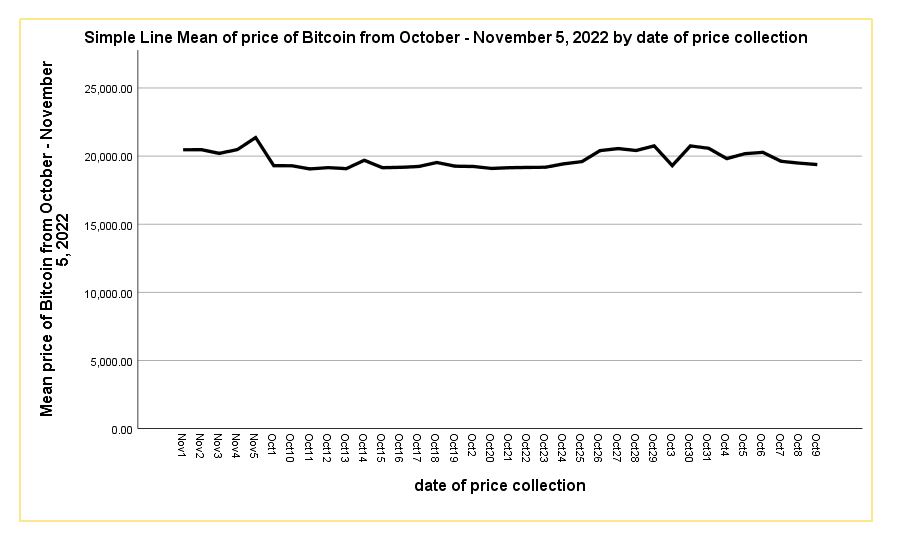
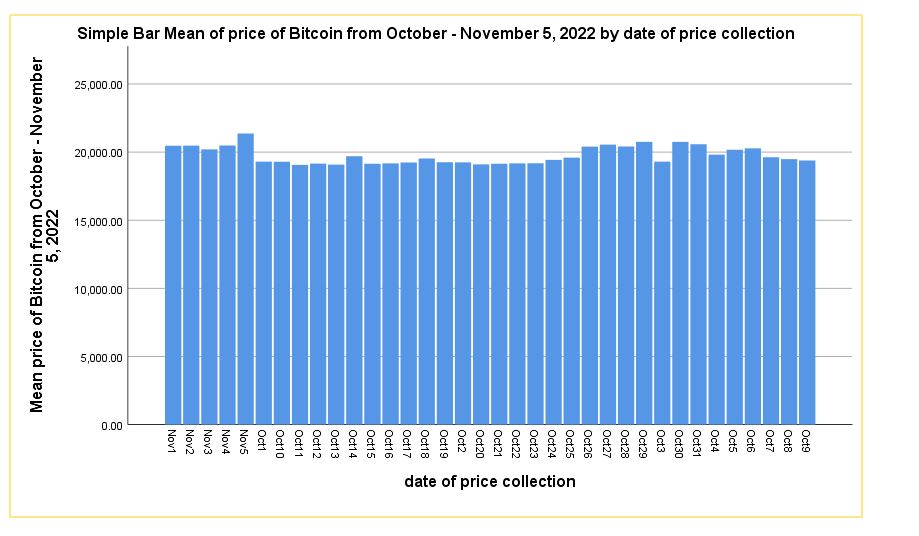
However, there was a bull price above $20,000 towards the ending part of October to early November, 2022. Details of this can be seen in the bar chart below.
- Box Plot of BITCOIN’s price
The boxplot of BITCOIN’s price shows the range of price within the stated period.
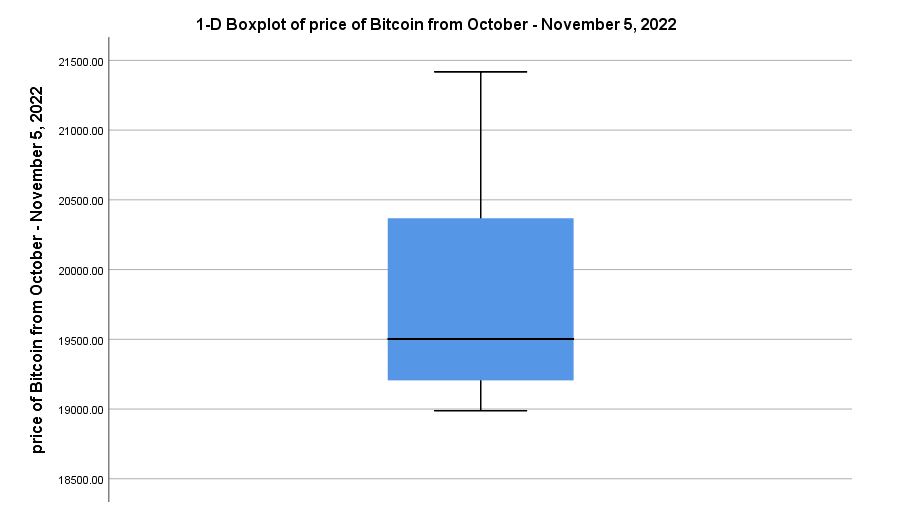
It is realized that the price never dropped below $19,000 but thriving to $21,500. From this analysis, BITCOIN price may get to $30,000 again.
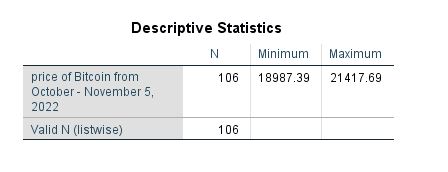
- Maximum And minimum price of BITCOIN
The maximum and minimum price of BITCOIN for the stated period can be seen in the table below.
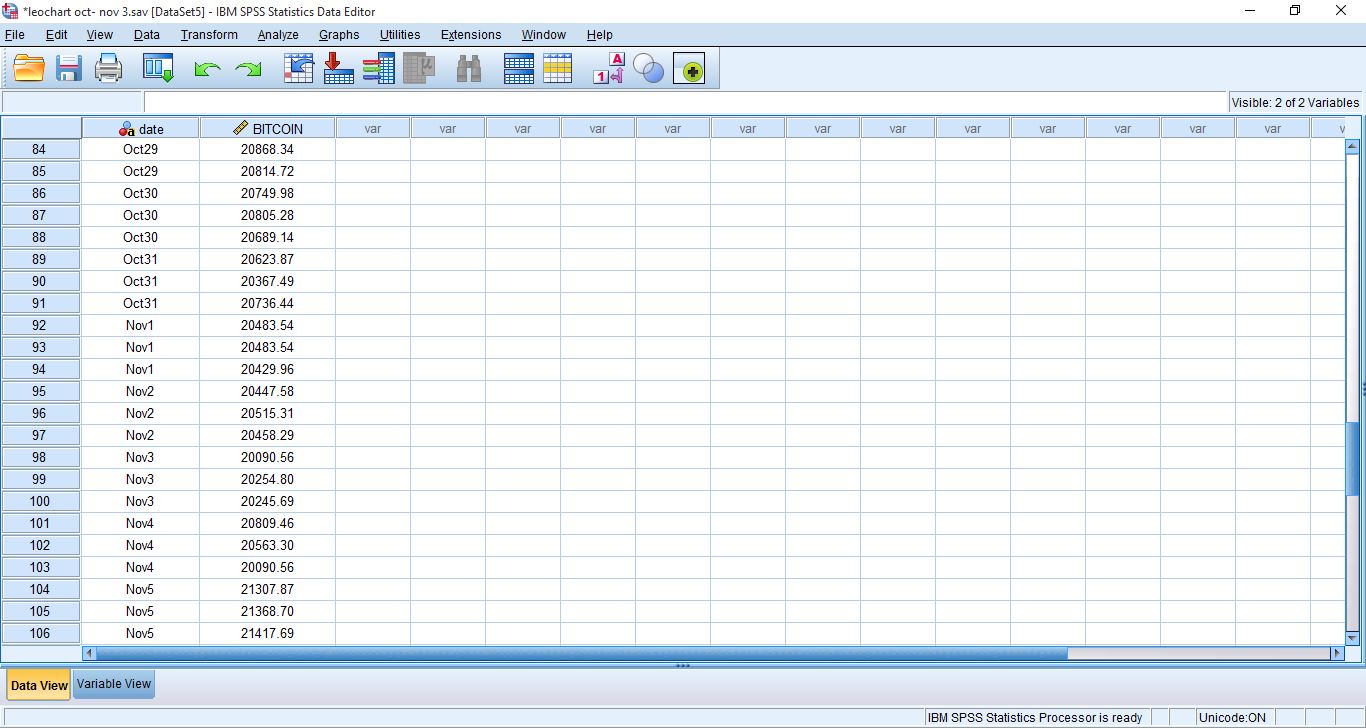
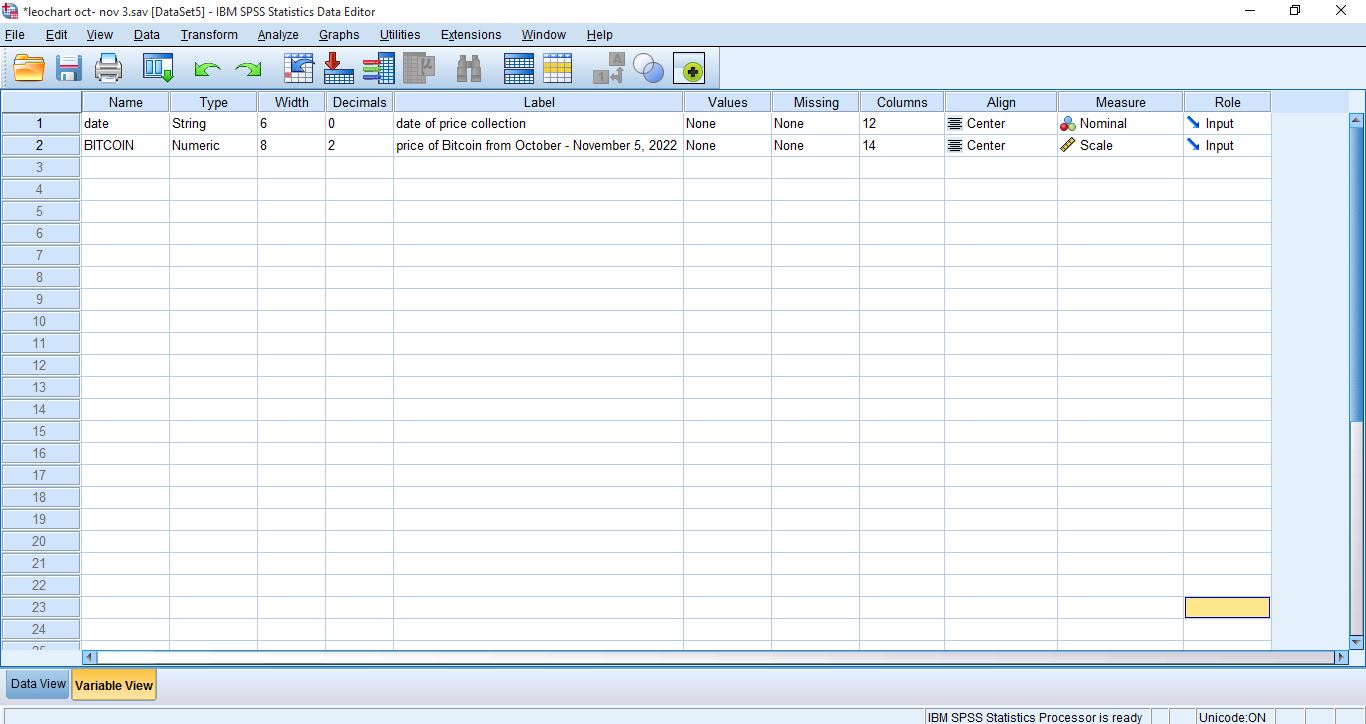
- Data view and Variable view of Analysis
Data view enables the price of BITCOIN to be entered into SPSS application which is seen below.
Variable view permits the entry for BITCOIN price as a variable.
Conclusion
This article has been able to present a descriptive report of BITCOIN’s price in terms of line graph, bar chart and boxplot. Other features are minimum and maximum price and data/variable entry.
Thanks for reading.