Analysis Of POLYCUB Price using SPSS
This article presents the analysis of POLYCUB price from the month of October 1 – November 11, 2022.
It shall be considered under the following description;
1D Boxplot of POLYCUB Price
The boxplot shows the price range of POLYCUB price, it can be seen there is an unusual dip in the price of POLYCUB which also indicates a good opportunity to buy as it correlates with HIVE price.
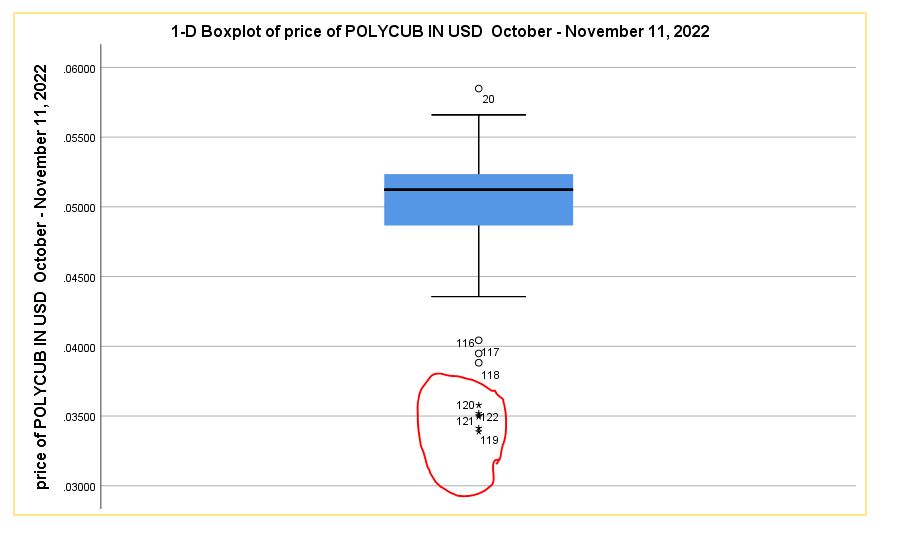
The usual rice range is between the box, then any indication of price outside the box calls for a moment of buying because the price is in a bearish zone.
Line graph of POLYCUB Price
The line graph for the price of POLYCUB indicates a more detailed view of the boxplot.
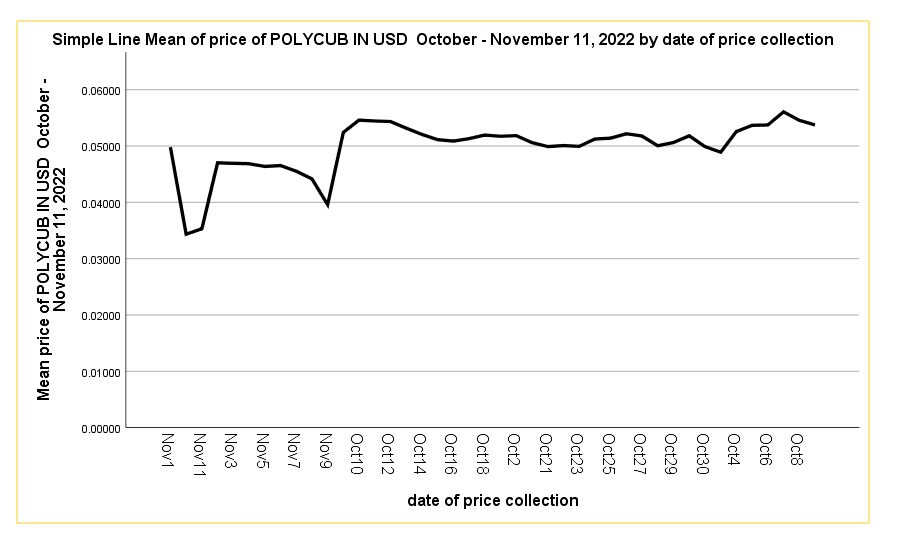
It is visible during the month of November 1 – November 9, 2022. The price was in a bear market. This will enable buyers make good decision initiates to purchase POLYCUB.
Bar chart of POLYCUB price
The barchart of POLYCUB price is seen below. It gives an explanation to the line graph.
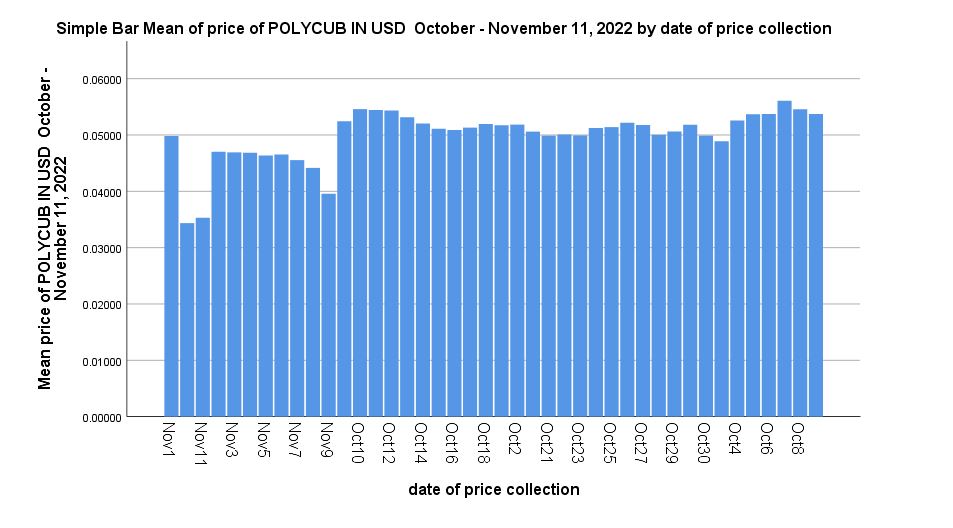
The difference between the two is that in a line graph, information is represented in lines whereas bars for bar chart.
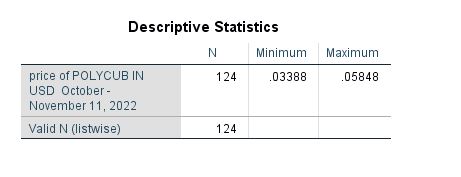
Maximum and minimum Price of POLYCUB
The maximum and minimum price of POLYCUB can be seen in the table below.
Conclusion
This article has been able to present a descriptive survey of the price of POLYCUB. The next analysis will be that of LEO.
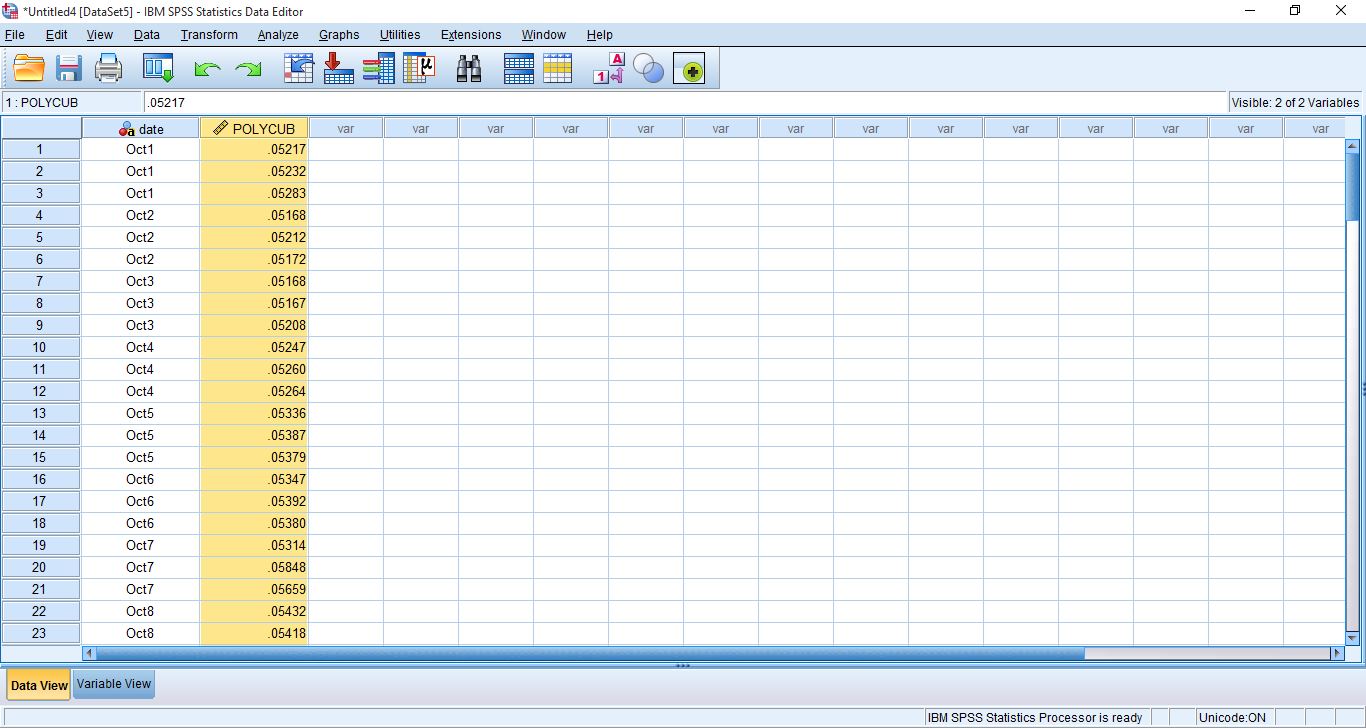
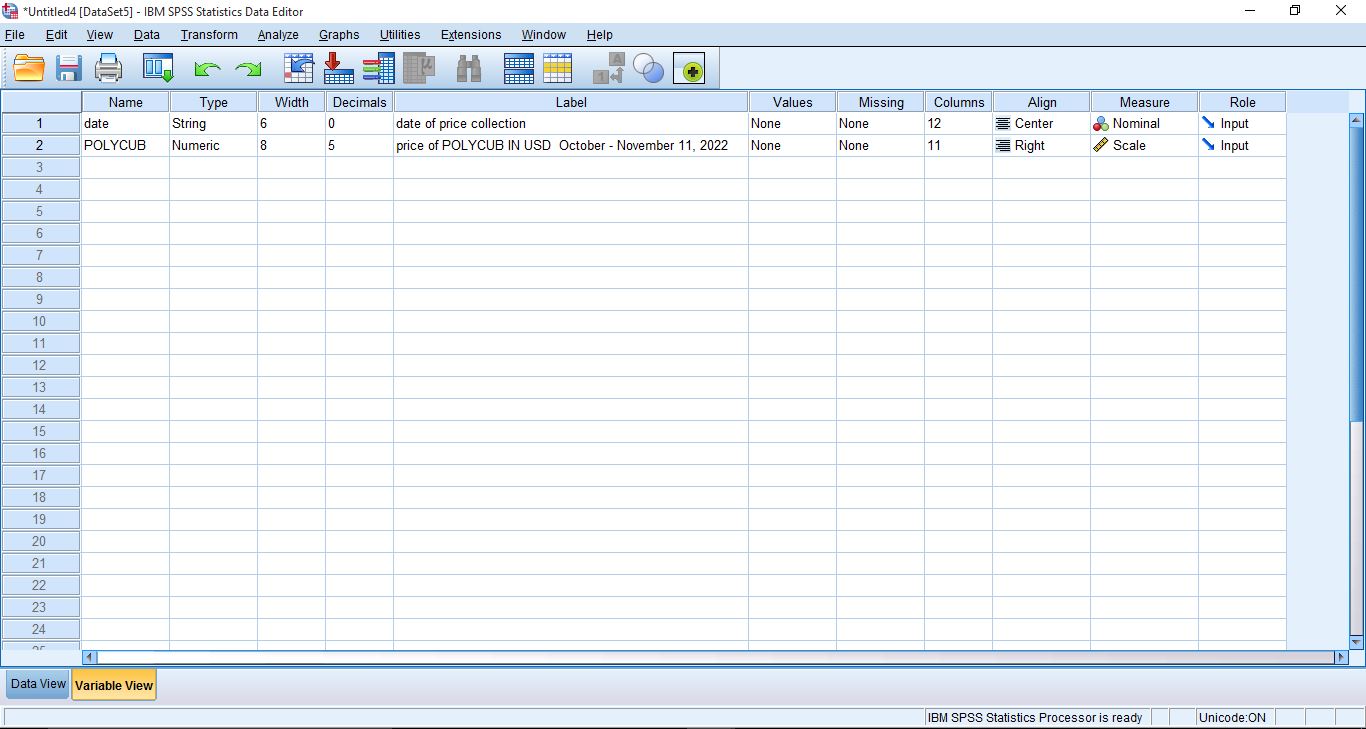
Other pictorial spreadsheet view for data entry is as shown below.
Thanks for stopping by, do have a blessed day.
https://twitter.com/1455313948425732098/status/1593477196030660608
The rewards earned on this comment will go directly to the people sharing the post on Twitter as long as they are registered with @poshtoken. Sign up at https://hiveposh.com.