Analysis Of HIVE Price In Excel
One of the essential aspect as regards crypto investment is a statistical inference of assets. A good investor will never take away the use of charts to evaluate performance of an asset as regards.
In this article, I will use HIVE price to analyze its performance in December 2022 and January 2023.
A very important consideration I want to present is the numerical values on the X axis of HIVE line chart. The values represent entries of HIVE price filling each rows. My entry were summarized as 133 in number. The highest and lowest numerical values represents the period from December to January 2023.
I will consider the following subtitles as regards this subject.
Line graph of HIVE in December, 2022
Line graph of HIVE in January, 2023
Maximum and minimum price of HIVE
Conclusion
Line graph of HIVE in December, 2022
Below is a line graph showing the performance of HIVE price in December, 2022.
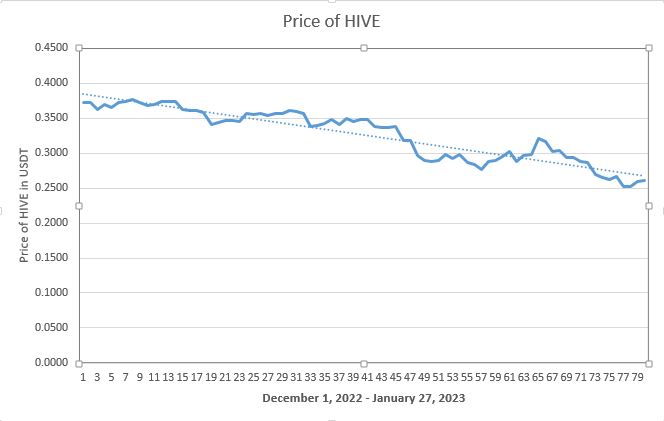
The price of HIVE was for double entry of similar dates. This aids to provide an average for each day. The line chart for HIVE in December shows a period where the price was on a low. I was even concern if HIVE may experience a bull in that same month but It looks like that period called for buying.
Line graph of HIVE in January, 2023
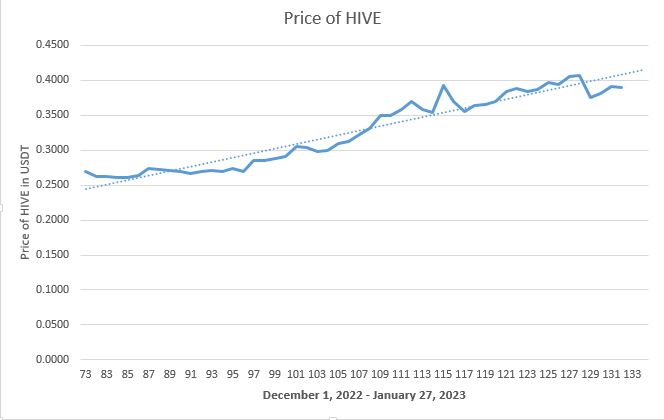
The line graph shows the performance of HIVE in the month of January 2023. Of course, January came with a bullish season for HIVE/ other assets and there was a significant change in the price of HIVE.
It can be considered that viewing the moving average line, the price of HIVE is heading towards half of a dollar. If there are no instances of chaos in the market, within January to February the price of HIVE might rise above 5 cents.
Summarized line chart for December, 2022 and January, 2023
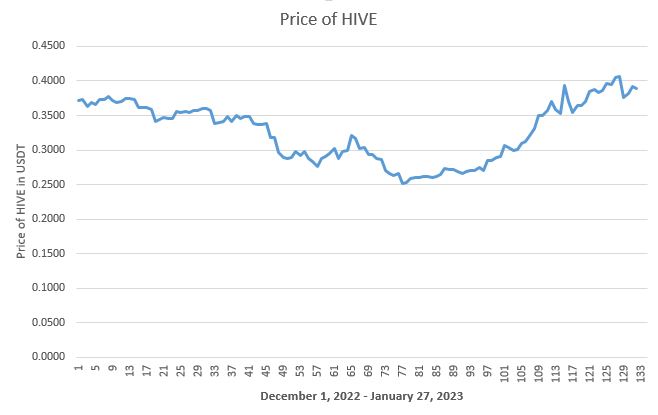
The summarized line chart showing the price combination for December and January is been displayed below.
It is visible that HIVE performed fast beyond expectation above 4cents than in the month of December as explained.
Other Statistics as related to the price of HIVE
Other statistics as related to the price of HIVE are maximum, minimum price, average price for each month.
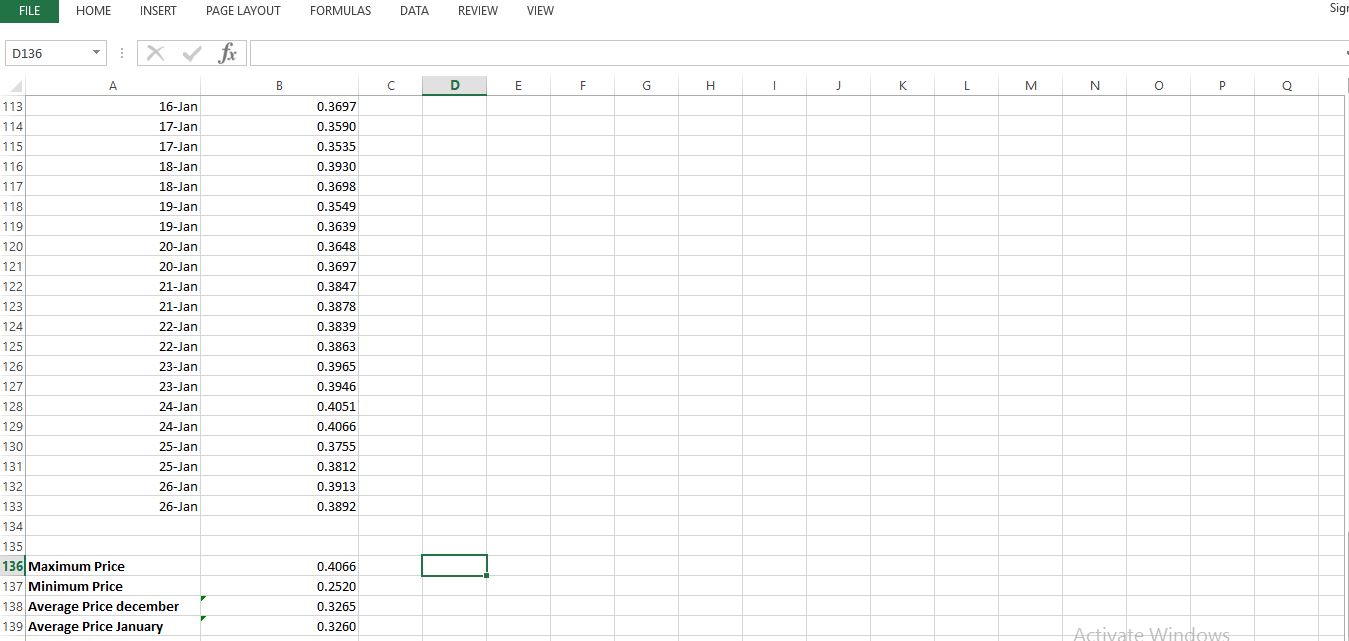
Maximum price of HIVE
The maximum price of HIVE can be seen in the image above. It indicates an amount of $0.4066. This price level was discovered in the month of January 2023 of the data set.
Minimum price of HIVE
The minimum price of hive is $0.2520. This occurred in the month of December, 2022. Although it was a bearish season for most crypto assets but HIVE made it through the season.
Average price in December and January
The average price of HIVE in December and January is shown above however there is less of information attached to it. Reasons been that:
A lot of statisticians do not pay attention to average price of an asset due to volatility. During the first week on the month an asset may be low in price and suddenly rise up to a better price during the last two weeks finding such average may not yield meaningful information.
Conclusion
The price of HIVE is moving above expectation and in my own analysis, if everything remains the same, the price of HIVE may likely estimate up to one dollar in the coming months.
Thanks for reading, do have a lovely day.
All images in this article are mine.