Technical Analysis: Why has "SOLANA" risen so much in a short period of time? [EN-ES]
This image has been created in CANVA
English
In this publication I will make a small technical analysis of SOL (SOLANA), a really interesting project and that in the last year has risen exponentially by more than 10,000%, so it is very worthwhile to take a look, because currently, the project is booming, all thanks to many factors that I would probably explain on another occasion, where I could talk more deeply about everything related to this great project.
Now, before starting directly with the analysis, I will talk a little about what the project is, to later begin with the study of the graphs:
What is Solana?

Solana is a project that started in 2017 but saw the light in 2020, likewise "Solana" is a project based on open source Blockchain technology, having as the main feature to be decentralized. It has aspects very similar to old Cryptocurrencies such as "Bitcoin and Ethereum", so it is a network where we can create Dapps (Decentralized Applications) and NFTs. Its consensus protocol is something that has never been seen before and makes "SOL" very different from the others, since it is an extremely fast and scalable network, compared to its predecessors.
Its consensus algorithm called Proof of History (PoH), emphasizes timestamps, so that the other nodes that make up the network, are aware of what is happening, this is what causes the speed at which blocks are verified and/or validated, are incredibly fast, reaching up to 400,000 transactions per second.
Now that we know a little about the project, let's take a look at its graph and what we can expect from it in the near future:
Technical Analysis of SOL - 1 Week and 1 Day Chart
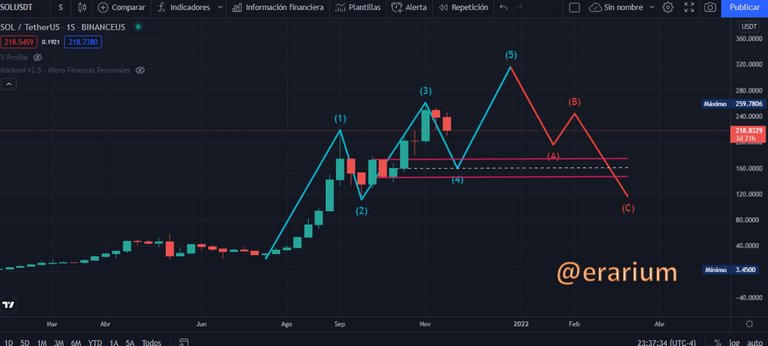
In 1S charts the SOL is in a clear uptrend, making higher highs and higher lows, in addition, in my opinion, it is in wave number 4, which can make a correction to the area of $159.37 and $145.03. If this happens and the price reacts and seeks liquidity in this area mentioned above, we could see the formation of a "Wave No. 5" that could take the SOL beyond $300. Then, an ABC type correction could follow, where there is the probability that the SUN will experience a drop in price that could take it around $90 or lower. Of course, the following must be kept in mind:
That the price after Wave N°5, continues to rise or performs the ABC correction.
That the price instead of seeking liquidity, the structure changes from bullish to bearish, and we see a significant pullback in the price of the SOL.

In the 1D timeframe, we can also see a clear uptrend, but with the impulse wave count already finished, so we are currently in the corrective wave "A". Now, there is a possible bullish "Order Block" in the area of $206 and $181, taking into account that the optimal entry zone is marked approximately at the Fibonacci level of 78.6%. In a shorter time frame, we could see a price correction to around $150 and then look for further upside momentum in another area that is optimal, around $147 which is the area where it is likely to look for more liquidity for another new rally. However, this is speculation and the following could also happen:
That the price changes structure by breaking the recent higher lows.
That the price continues its bullish course and effectively seeks liquidity at the mentioned points.
SOL Technical Analysis - 1 Week Chart
Really this is a project with huge growth for the years to come, in my opinion having SOL tokens in HOLD is a great investment, taking into account that a lot of really promising projects are being born in the SOLANA network, for example, the game "Star Atlas", which is being developed in an incredible way, something that of course is very positive for the network, it is a really ambitious game and I am really interested in investing in it in the long term.
And to finish, I hope you liked this analysis, I am returning to the technical analysis and I could bring more posts like this, and even analyze some of the projects of this fabulous project called SOLANA.

Español
En esta publicación hare un pequeño análisis técnico de SOL (SOLANA), un proyecto realmente interesante y que en el último año ha subido de forma exponencial alrededor de más del 10.000%, por lo que, vale mucho la pena darle un vistazo, debido a que actualmente, el proyecto valga la redundancia, está en auge, todo esto gracias a muchos factores que muy probablemente explicaría en otra ocasión, donde podría hablar de forma más profunda sobre todo lo relacionado con este gran proyecto.
Ahora bien, antes de comenzar directamente con el análisis, hablare un poco de lo que es el proyecto, para posteriormente comenzar con el estudio de los gráficos:
¿Qué es Solana?
Solana es un proyecto que comenzó desde el año 2017, pero que vio luz en el año 2020, así mismo “Solana” es un proyecto basado en la tecnología Blockchain de código abierto, teniendo como principal característica ser descentralizada. Posee aspectos muy parecidos a Criptomonedas antiguas como “Bitcoin y Ethereum”, por lo que es una red donde podemos crear Dapps (Aplicaciones descentralizadas) y NFTs. Su protocolo de consenso es algo que nunca se ha visto y hace que “SOL” sea muy distinta a las demas, ya que, es una red sumamente rapida y escalable, en comparación con sus antecesoras.
Su algoritmo de consenso llamado Proof of History (PoH), hace hincapié en marcas de tiempo, para que el resto de nodos que conforman dicha red, estén al tanto de lo que está pasando, esto es lo que causa que la velocidad en la que se verifican y/o validan los bloques, sean increíblemente rápida, llegando a realizar hasta 400.000 transacciones por segundo.
Ahora bien, ya que sabemos un poco sobre el proyecto, veamos su gráfica y que podemos esperar próximamente del mismo:
Análisis Técnico de SOL – Grafico de 1 Semana y 1 día
En gráficos de 1S el SOL se encuentra en una clara tendencia alcista, haciendo máximos y mínimos cada vez más altos, ademas, de esto, en mi opinión se encuentra en una onda número 4, la cual puede realizar una corrección hasta la zona de los 159.37$ y los 145.03$. Si esto llega hacer así y el precio llega a reaccionar y a buscar liquidez en esta zona antes mencionada, podríamos observar la formación de una “Onda N°5” que, podría llevar al SOL más allá de los 300$. Luego, podría venir una corrección tipo ABC, donde existe la probabilidad de que el SOL experimente una caída en su precio que podría llevarlo alrededor de los 90$ o menos. Por supuesto, hay que tener presente lo siguiente:
Que el precio después de la Onda N°5, siga subiendo o realice la corrección ABC
Que el precio en vez de buscar liquidez, la estructura cambie de alcista a bajista y veamos un retroceso importante en el precio del SOL.
En temporalidad de 1D, también podemos ver una tendencia alcista clara, pero con el conteo de ondas de impulso ya finalizadas, por lo que actualmente estamos en la onda correctiva “A”. Ahora bien, hay un posible “Order Block” alcista en la zona de los 206$ y los 181$, teniendo en cuenta que la zona optima de entrada marcada aproximadamente en el nivel de Fibonacci de los 78.6%. En un plazo más corto de tiempo, podríamos ver una corrección de precios hasta los 150$ aproximadamente para luego buscar un nuevo impulso alcista en otra zona que sea optima, alrededor de los 147$ que es la zona donde probablemente busque mas liquidez para otro nuevo rally. Sin embargo, esto es especulación y también podría suceder lo siguiente:
Que el precio cambie de estructura rompiendo los últimos bajos más altos.
Que el precio siga su curso alcista y efectivamente busque liquidez en los puntos mencionados.
Análisis Técnico de SOL – Grafico de 1 Semana y 1 día
Realmente este es un proyecto con un crecimiento enorme para los años por venir, en mi opinión tener en HOLD los tokens SOL es una gran inversión, teniendo en cuenta que una gran cantidad de proyectos realmente prometedores están naciendo en la red de SOLANA, como por ejemplo el juego “Star Atlas”, el cual está siendo desarrollado de una forma increíble, algo que por supuesto es muy positivo para la red, es un juego realmente ambicioso y realmente me interesa mucho invertir en el a largo plazo.
Ya para finalizar, espero que este análisis les haya gustado, estoy volviendo a los análisis técnicos y podría traer más post como este, e incluso analizar algunos de los proyectos de este fabuloso proyecto llamado SOLANA.


@tipu curate 5
Upvoted 👌 (Mana: 0/100) Liquid rewards.