Similarity Between Reversing of Hive Price
There are similarities on Hive price chart between January 2023 and now.
Hive price went up from 0.25 USD to 0.63 USD at the beginning of 2023. After being traded on 0.26 USD a few days, Hive price went up to top line of Bollinger Bands in daily chart.
We are at same scenario now. Hive price went up from 0.27 USD and trying to hit the top line of Bollinger Bands...
If Hive price touch the top line of Bollinger Bands, we may see pump on Hive price chart.
Here you can see daily chart of Hive and I circled the similarity of Hive price reversing..
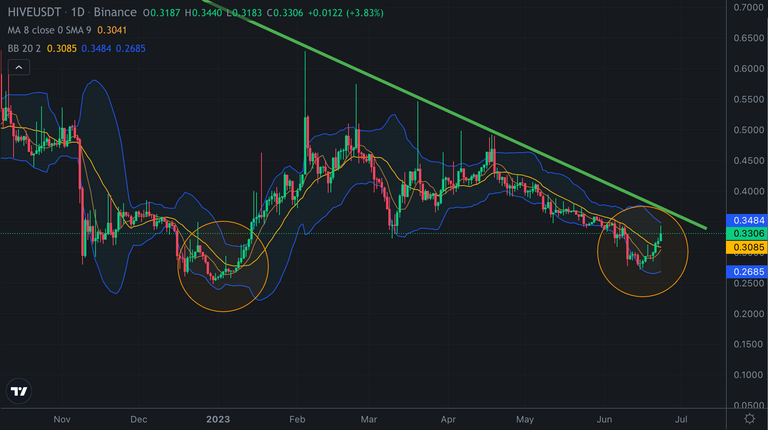
If Hive price reverse and enter bullish trend, It may break up great resistance..
There is great resistance on RSI Indicator coming from the beginning of 2023, broken up. It may be a signal of bullish trend..
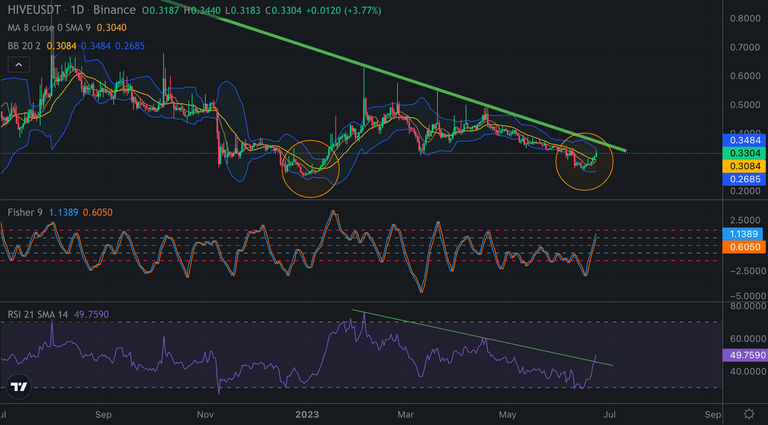
We are getting bullish trend signals day by day.
I am trying to share with you these signals. I always say that Hive is not only a crypto for me. It show us crypto trend clearly..
We will see..
