Similarity Between 2019 and 2023 in Bitcoin Price Chart
Past is our maps for future in Bitcoin price chart. There is similarity between 2019 and 2023 in Bitcoin price chart. As It shows us, mini bullish trend is over in 32K and Bitcoin need at least 6 months to reverse from the bottom. 2019 price chart shows us this scenario.
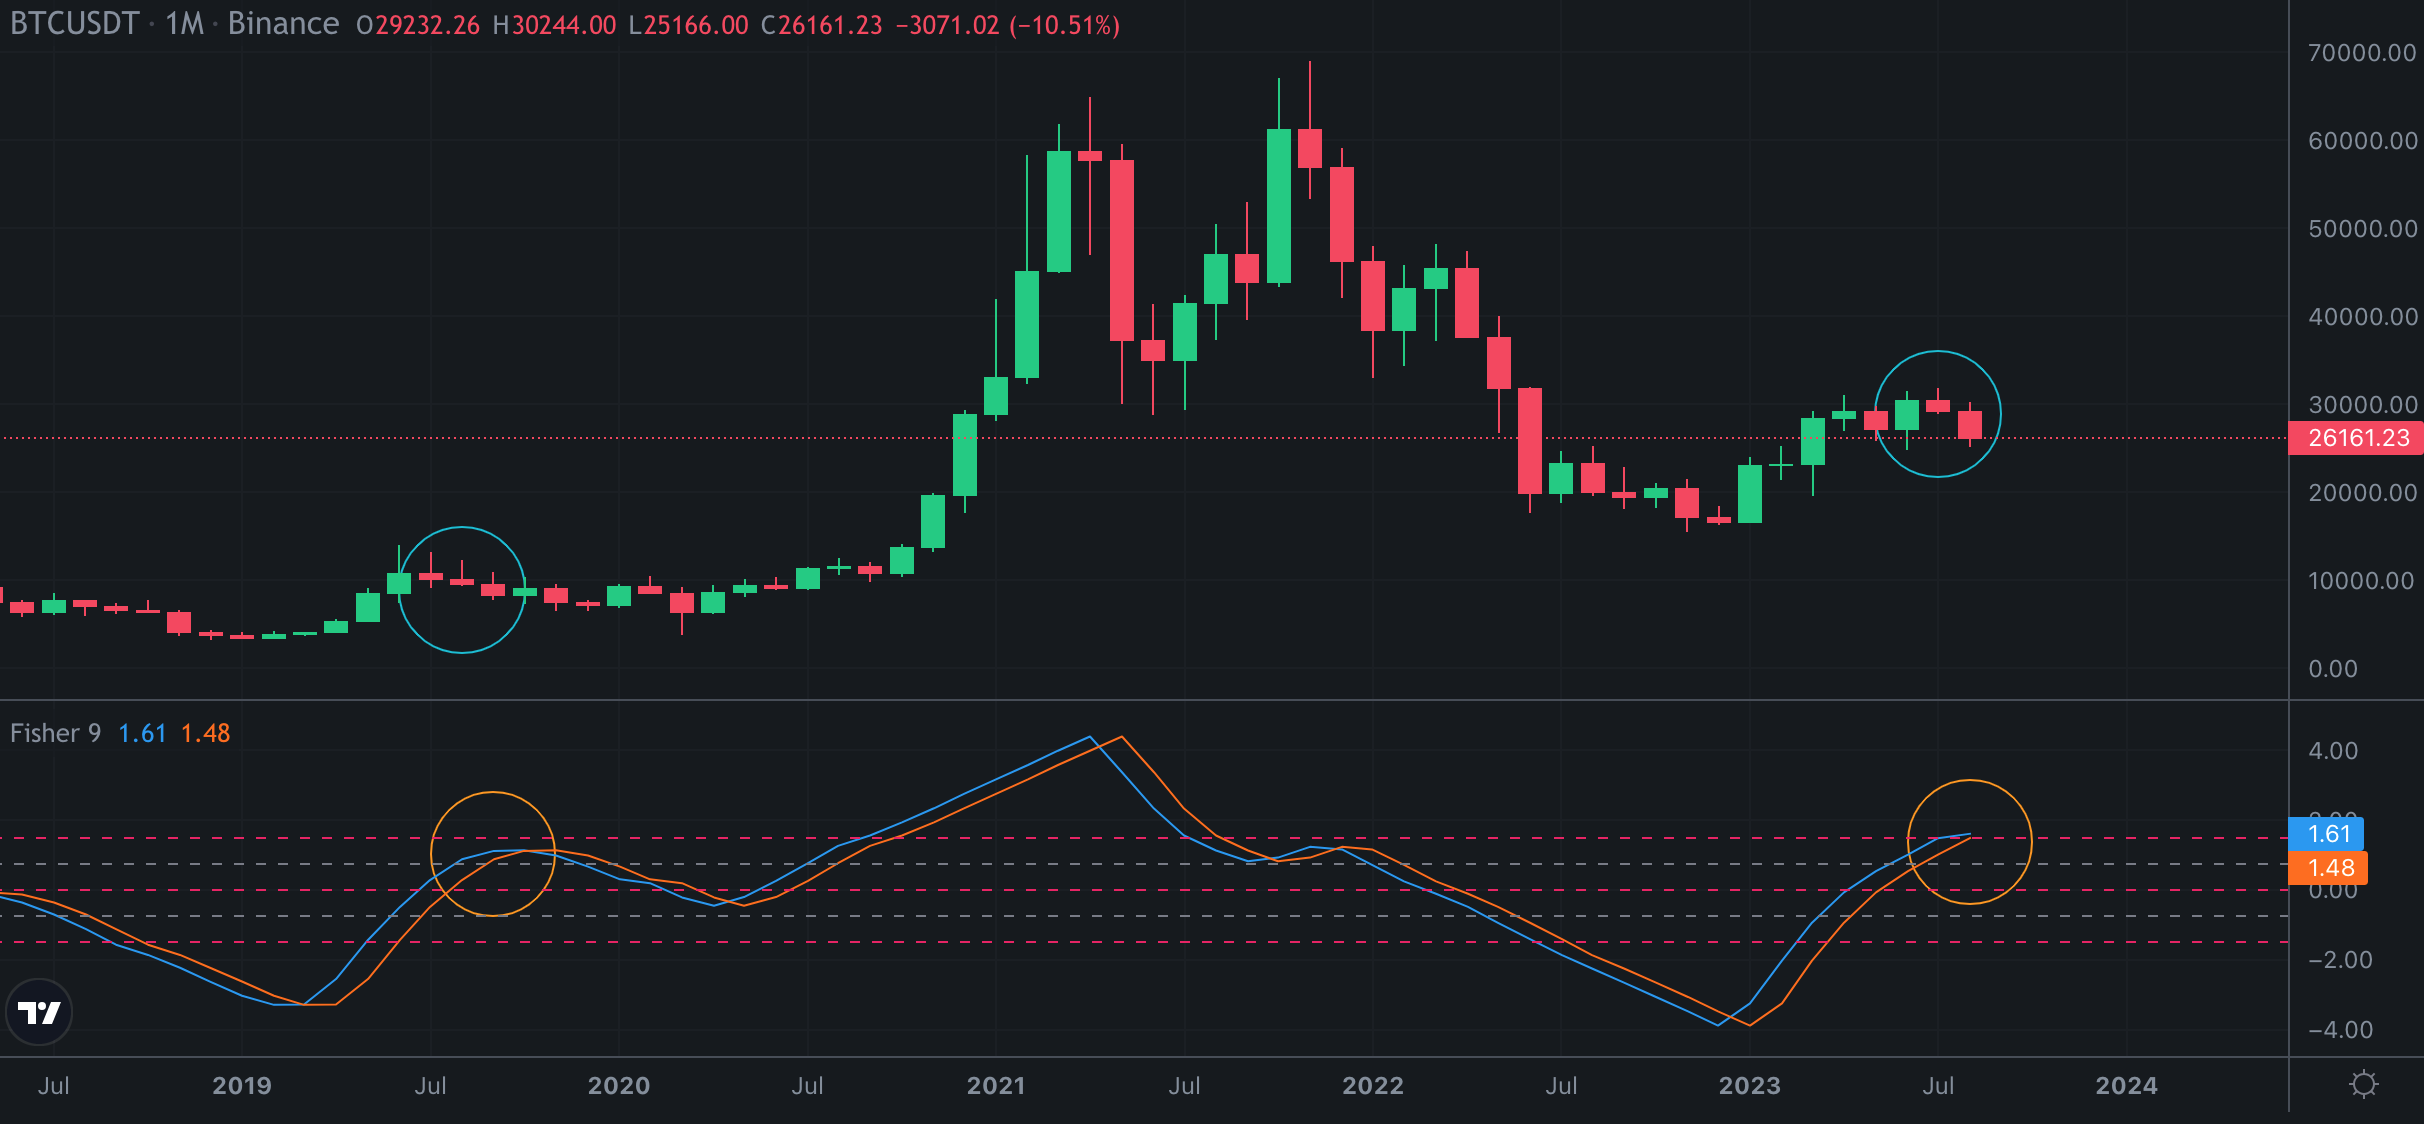
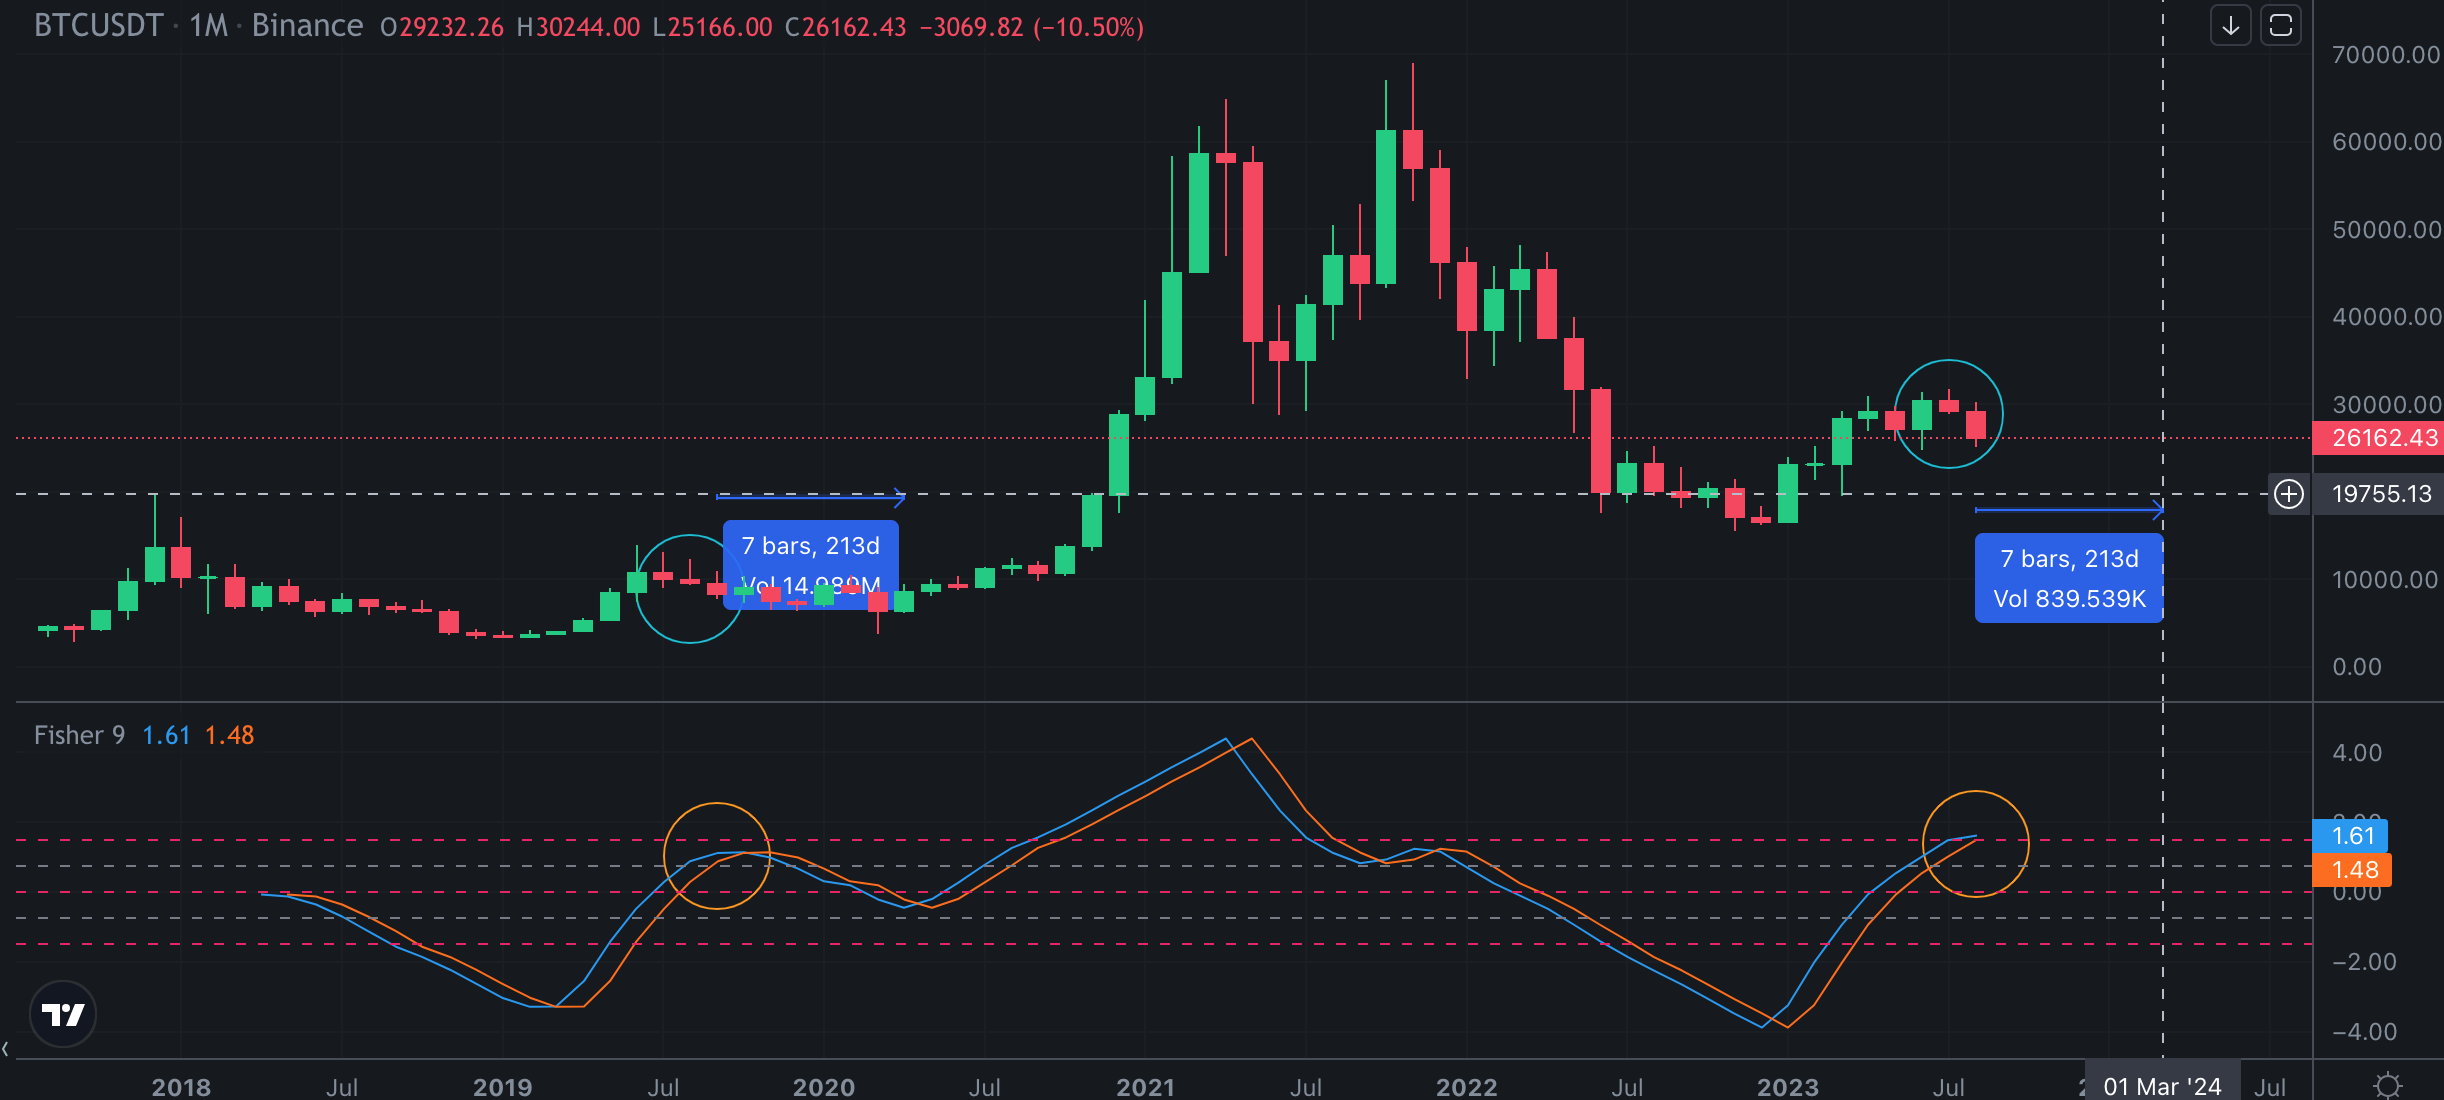
Here you can see monthly chart of Bitcoin price. I circled the similarities between 2019 and 2023. There is monthly fisher Indicator is it will reverse on the top. So, We will see mini bearish season for Bitcoin at least 6 months.
Halving will be the trigger of the market. Same scenario is on Bitcoin price chart. We need at least 6 or 7 monthly bars to find the bottom.
We will enter to pick up time for crypto. I will start to cash flow into the crypto market.
We will see..
Posted Using LeoFinance Alpha
https://leofinance.io/threads/chorock/re-chorock-2pswyabo6
The rewards earned on this comment will go directly to the people ( chorock ) sharing the post on LeoThreads,LikeTu,dBuzz.
Congratulations @chorock! You have completed the following achievement on the Hive blockchain And have been rewarded with New badge(s)
You can view your badges on your board and compare yourself to others in the Ranking
If you no longer want to receive notifications, reply to this comment with the word
STOPCheck out our last posts: