Bitcoin Price Touched the Support Line - Will it Break Down?
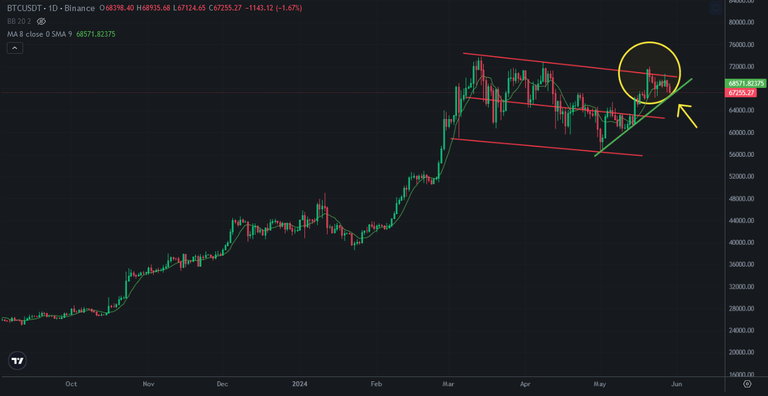
Today Bitcoin price touched support line at 67K. There is support line on Bitcoin price chart tested 4 times before. There was descending channel on Bitcoin price chart. I shared lots of analysis and said 72K bullish move was a bull trap. My thesis worked now and It is as a bull trap. Even Bitcoin broke uo downtrend line, we have not seen a daily close above this line.
Here you can see daily chart of Bitcoin. I circled bull trap. I drew an arrow to show you touching to support line. Will it break down?
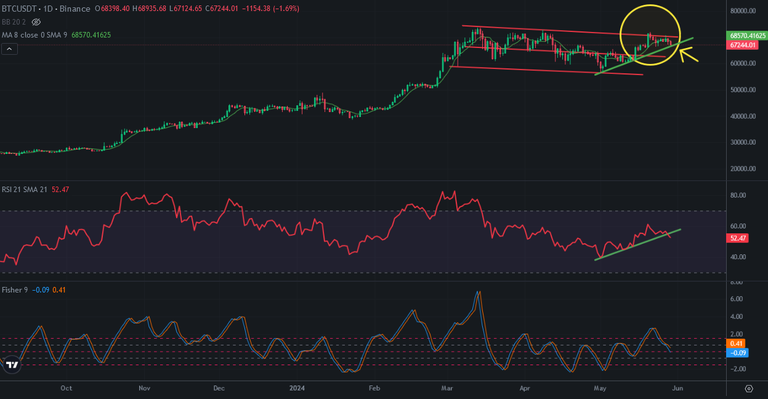
I think It will break down in a few days. Here you can see the indicators on Bitcoin price chart. RSI indicator is broken down. It is possible to see price breaking down on Bitcoin price chart. RSI showed us the future. We should wait breaking down on price.
End of month is coming soon. Even we see a bullish monthly candle, price dump is coming soon.
I will not get into a bullish trap. I am waiting for price dump on Bitcoin price chart.
We will see...
Posted Using InLeo Alpha