Bitcoin Price is Supported by the Bottom Line Of Flag Pattern
Even Bitcoin price went down from 30K to 26K in only a few days, There is good bullish setup. Even lots of investors are in fear to continue loss, I think mini downtrend may be completed..
Here you can see daily chart of Bitcoin price and there is bullish flag pattern. It is hard to see the bottom line of flag to be broken down..
I shared an analysis for Bitcoin price chart and said It may be time to pick up discounted crypto..
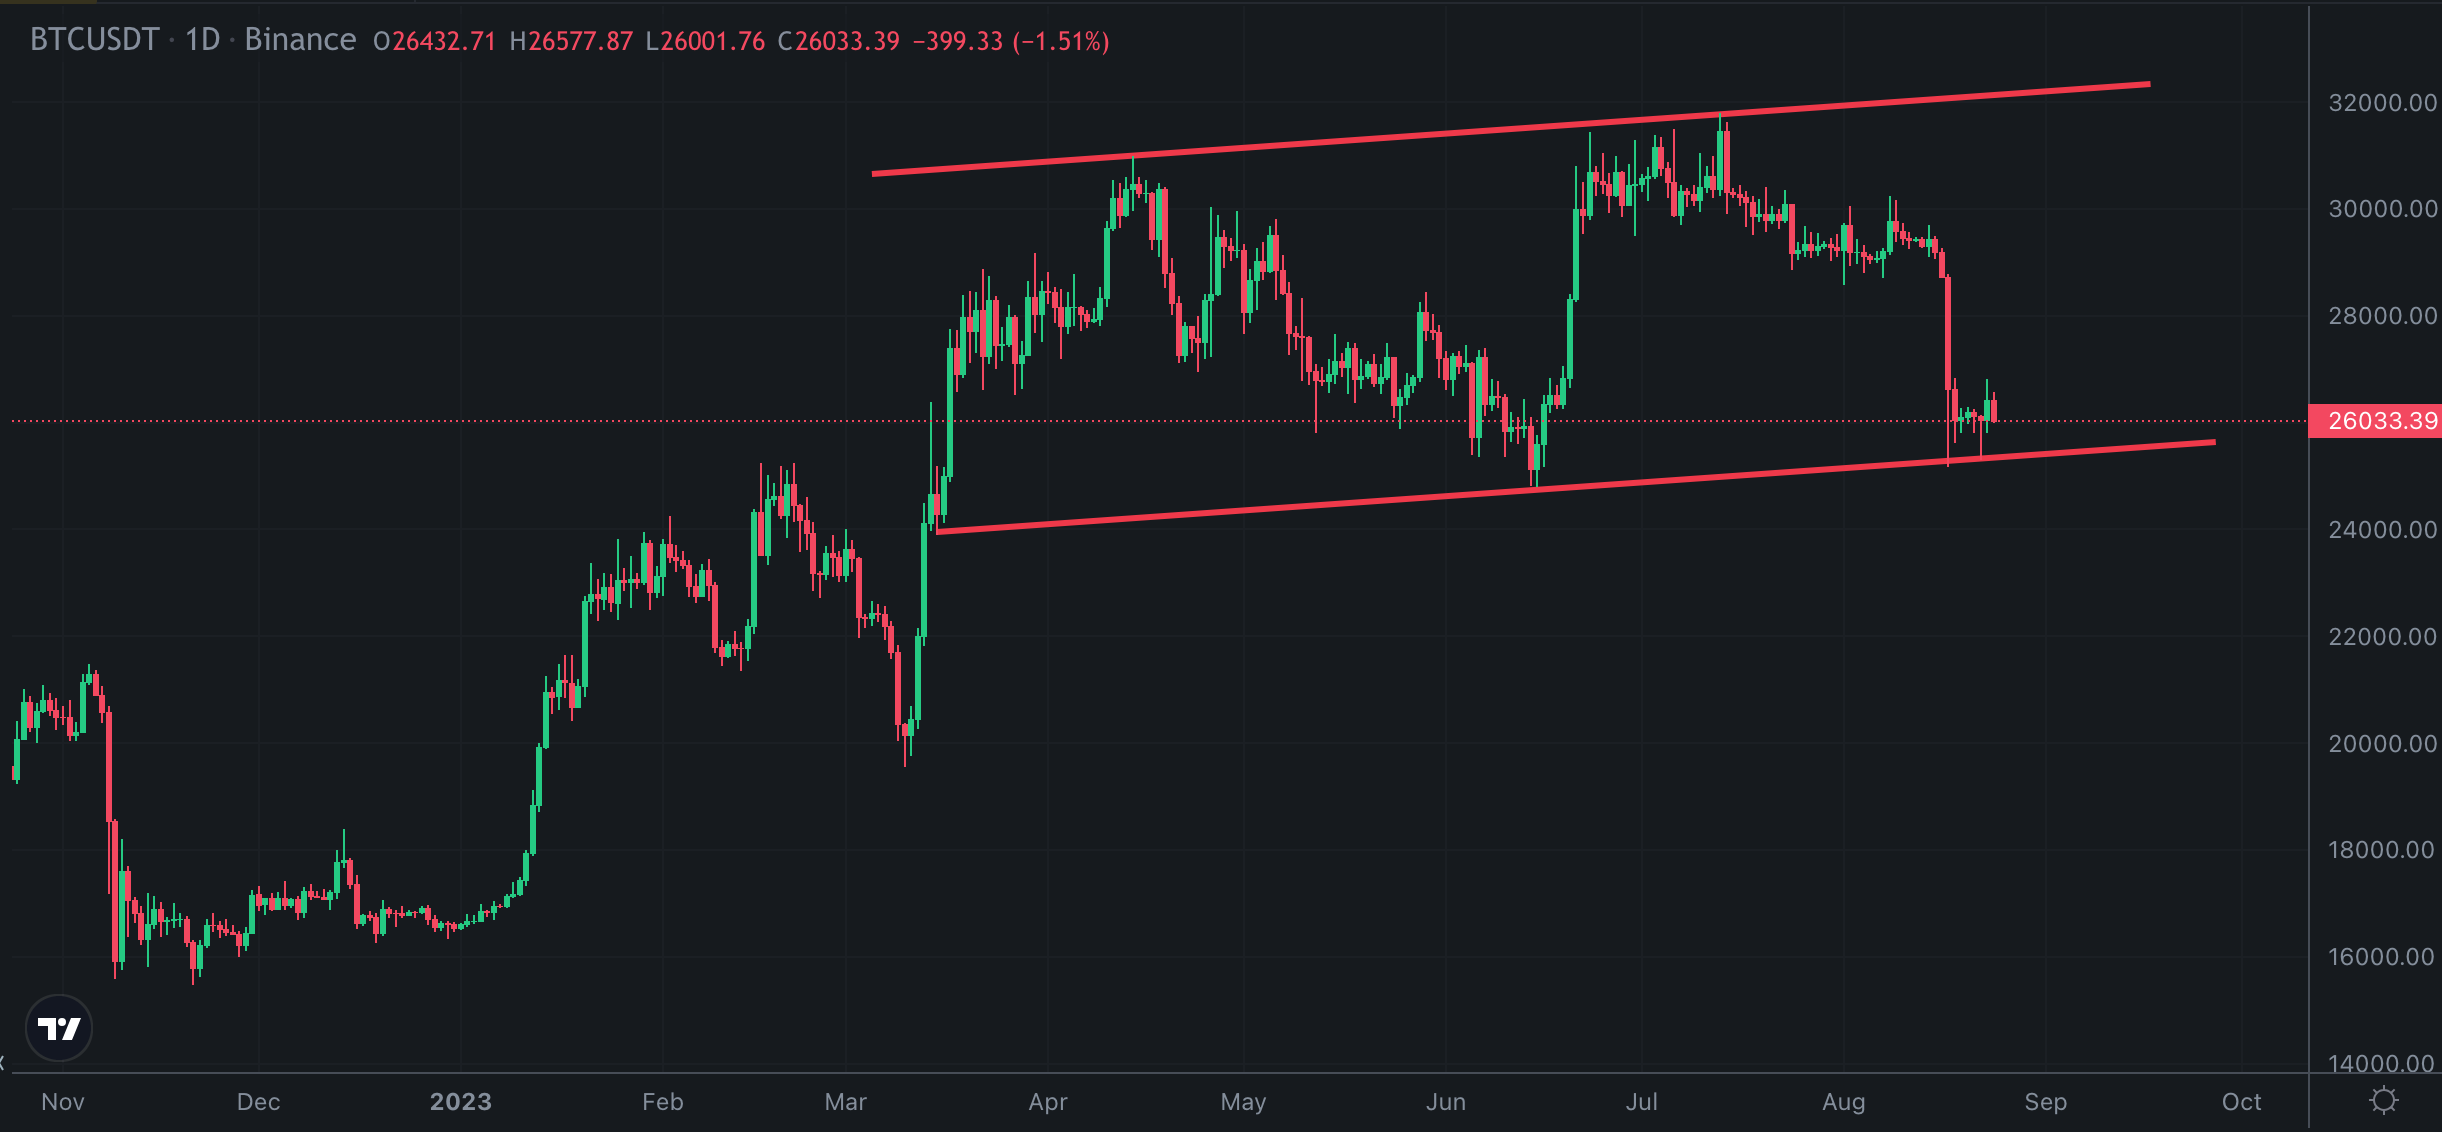
It is 3rd time to touch the bottom line of bullish pattern and It is hard to break down. It may be time to reverse for Bitcoin price.
Here you can see MACD Indicator in daily chart and selling pressure is decreasing. There downtrend line coming from 32K and Bitcoin price may hit again this resistance.
The first target is to reach yellow resistance line..

So, While lots of investors are in fear and selling, It may be great time to pick up..
We will see..
Posted Using LeoFinance Alpha
https://leofinance.io/threads/chorock/re-chorock-giunext8
The rewards earned on this comment will go directly to the people ( chorock ) sharing the post on LeoThreads,LikeTu,dBuzz.
The majority is always wrong. That's why we need to position ourselves on the other side of the majority.
View or trade
BEER.Hey @chorock, here is a little bit of
BEERfrom @pixresteemer for you. Enjoy it!Learn how to earn FREE BEER each day by staking your
BEER.It is a reasonable perspective. I hope to see the BTC price break the upper band of the flag.