Bitcoin Price Broke up Curve Resistance
(Edited)
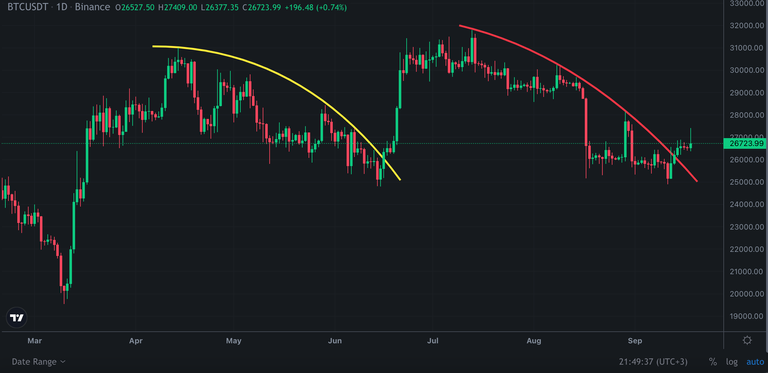
Bitcoin price broke up the curve resistance coming from July. There are curve resistances on Bitcoin price chart. Bitcoin broke up 2nd one of these curve resistances..
Here you can see daily Bitcoin price chart and we can see same patterns in 2023. Bitcoin draw same curve pattern since April.
There is also flag pattern on Bitcoin price chart. I shared lots of analysis for Bitcoin and said 25500 USD is very important.. Even it is broken down, it was a bear trap. Lots of Fudders and short lovers rekt..
Here you can see flag pattern coloured blue. The target of breaking up curve resistance is the middle line of flag pattern. Its level is about 28500 USD..
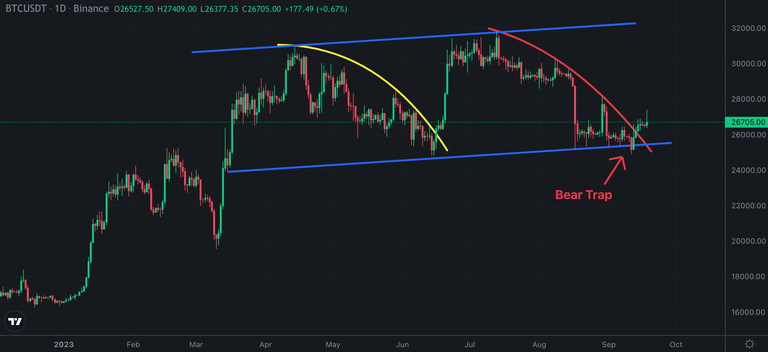
It is possible to see Bitcoin price in 28500 USD..
We will see..
Posted Using LeoFinance Alpha
0
0
0.000
https://leofinance.io/threads/chorock/re-chorock-9mpsfqcf
The rewards earned on this comment will go directly to the people ( chorock ) sharing the post on LeoThreads,LikeTu,dBuzz.
@resiliencia pay attention to this guy since you started looking at charts so often lately.
This is great news for cryptocurrency at large. We can only hope for a surge in about couple of weeks, if only btc break the resistance and move upwards to $27000 or above