Bearish Trap Appeared on Bitcoin Price Chart
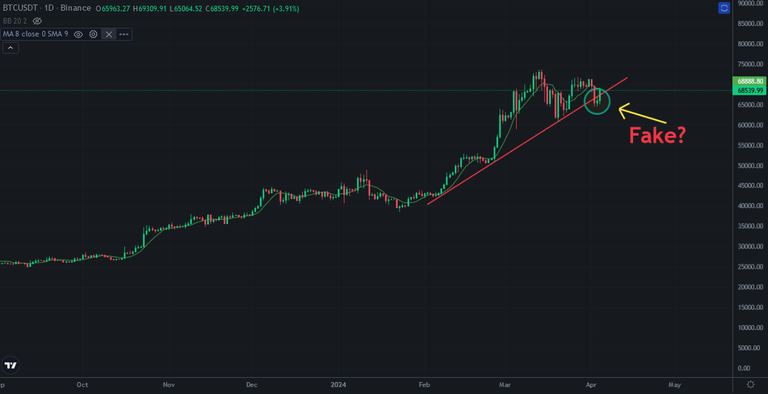
Bitcoin price is under correction after touching 74K. It went down from 74K to 62K and price seems stable for a few days. There is support line on Bitcoin price chart coming from February when Bitcoin price was 40K. Bitcoin price broke down this support line two days ago. It may be a bearish trap?
Here you can see daily chart of Bitcoin. I circled the possible bearish trap on Bitcoin price chart. I said it as possible bearish trap. I will explain why I said that.
Here you can see 4-hour chart of Bitcoin. There are bullish setups on RSI Indiciator. I drew down trend lines on RSI Indicator and you can see what happened after breaking up..
This is why I said it may be bearish trap. We will see pump on Bitcoin price chart when RSI Indicator breaks up this downtrend line..
Bitcoin price went up after this breaking up. So, it is possible to see Bitcoin price going to all time high after breaking up..
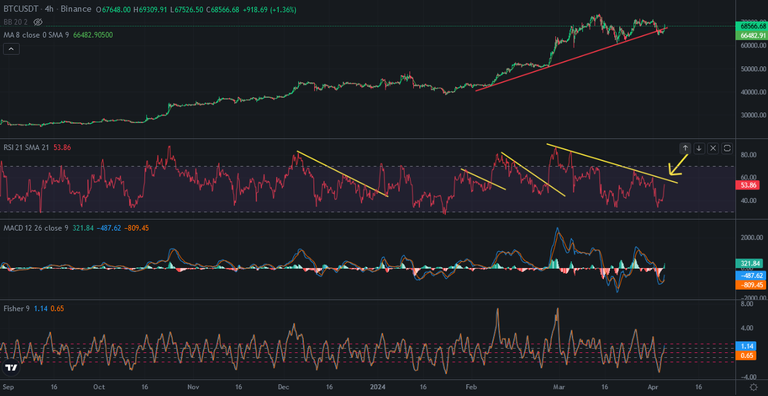
Lots of investors are waiting price dump on Bitcoin price chart. It may be a bearish trap. I will follow RSI Indicator on 4-hour chart.
We will see...
Posted Using InLeo Alpha
Is it going up or down ?