7 Red Weekly Successive Candles in Bitcoin Price Chart - When is Green?
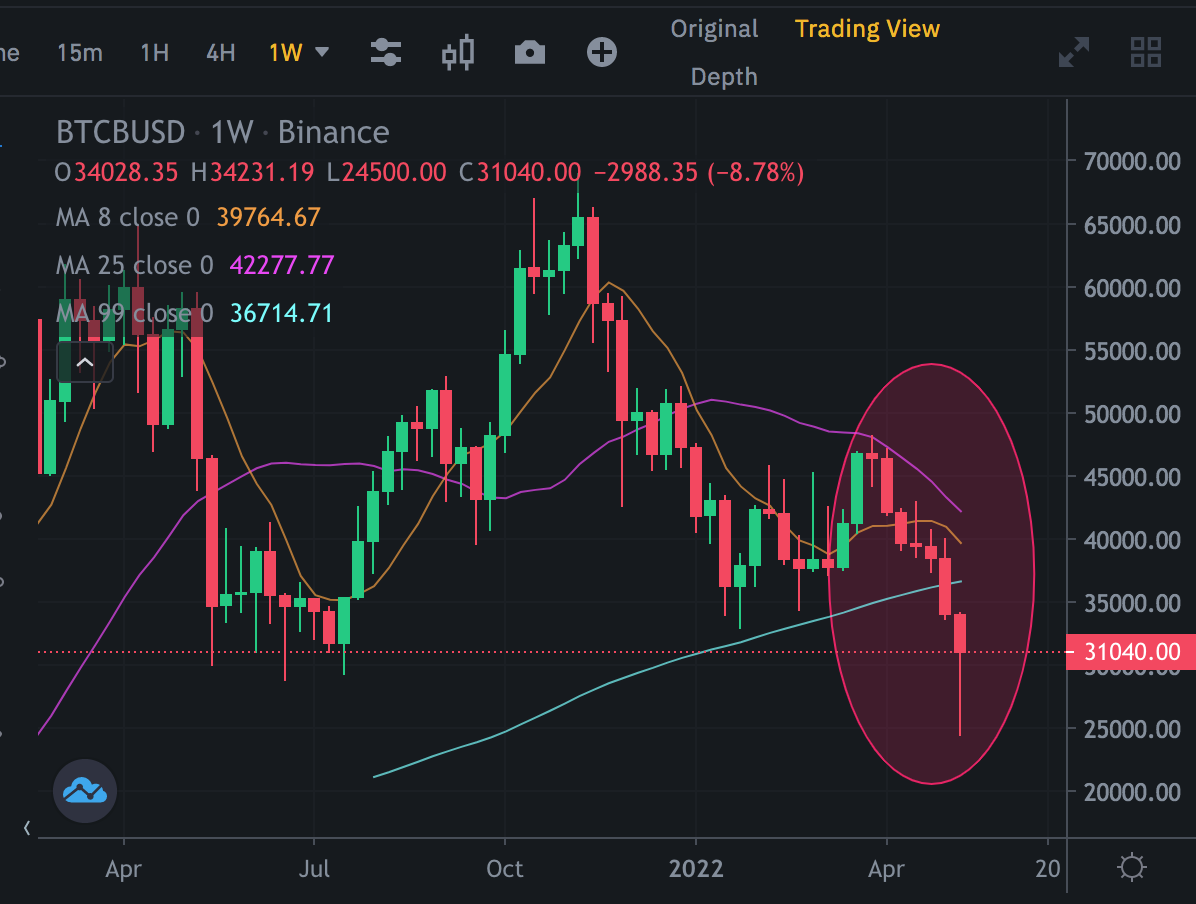
We saw 7 red weekly successive candles in Bitcoin Price chart. Thanks to Terra Luna crash, We experienced the darkest red weekly candle in this week.
After 7 weeks, Next week may be green.. It is not about statistic, technical analysis can show this...
There are lots of reason we should see green candle in next week..
We havent seen 8 red weekly candle in Bitcoin chart. So it is most possible to see green candle...
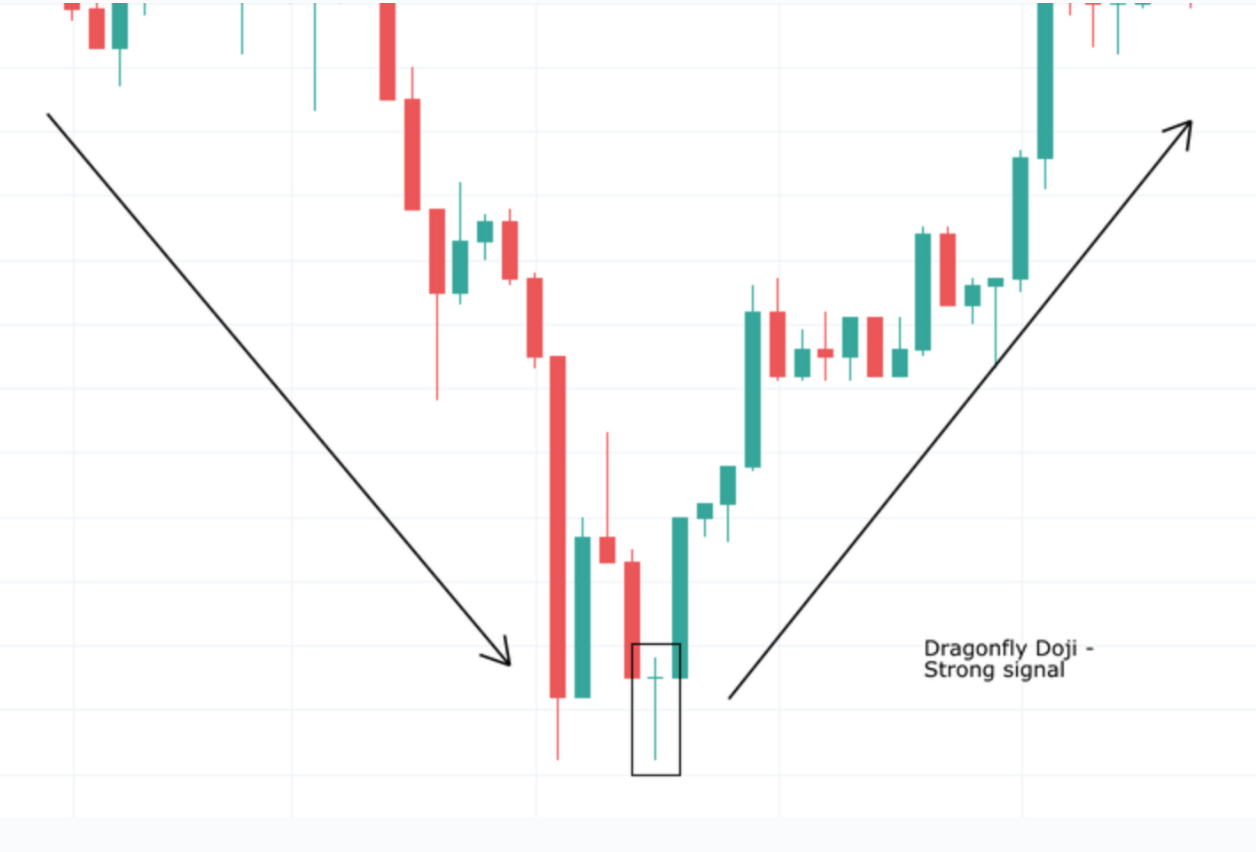
There is doji candle in weekly chart..
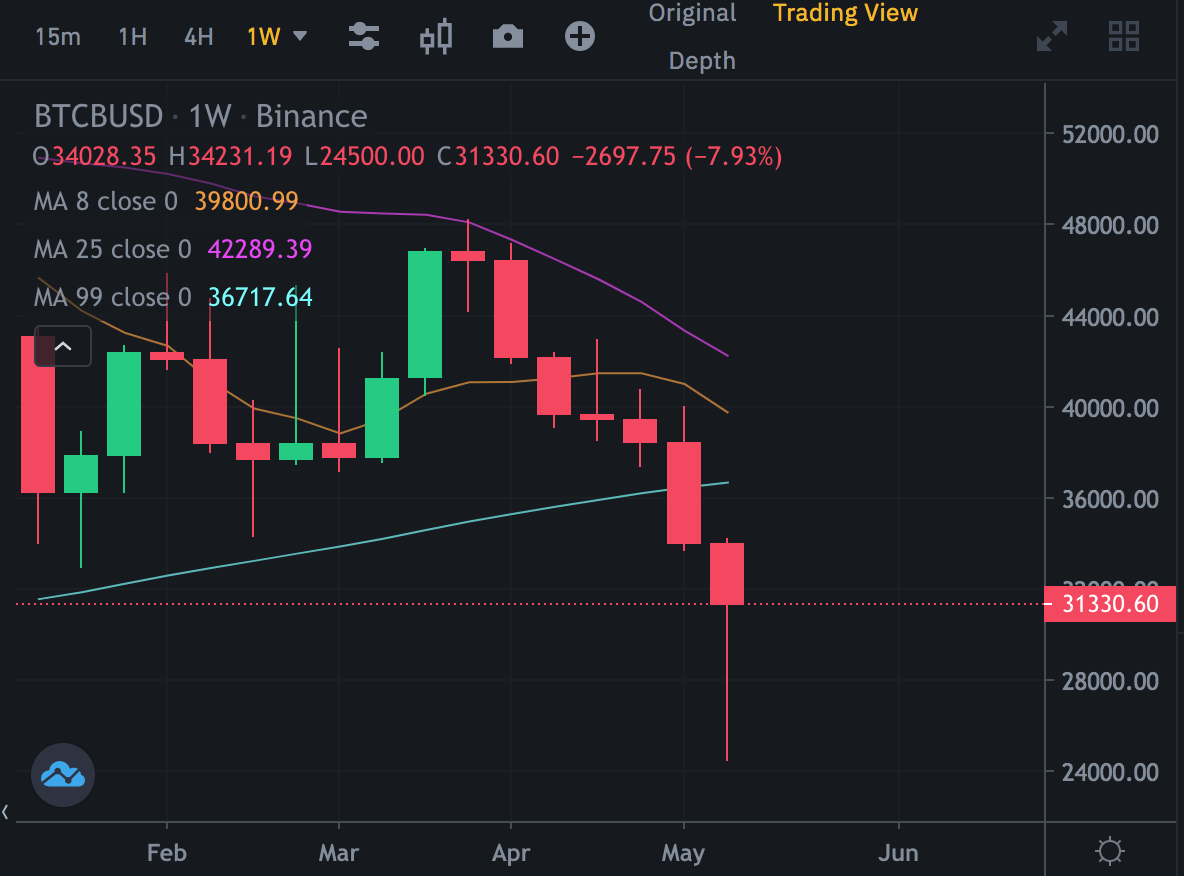
It is strong bullish signal...
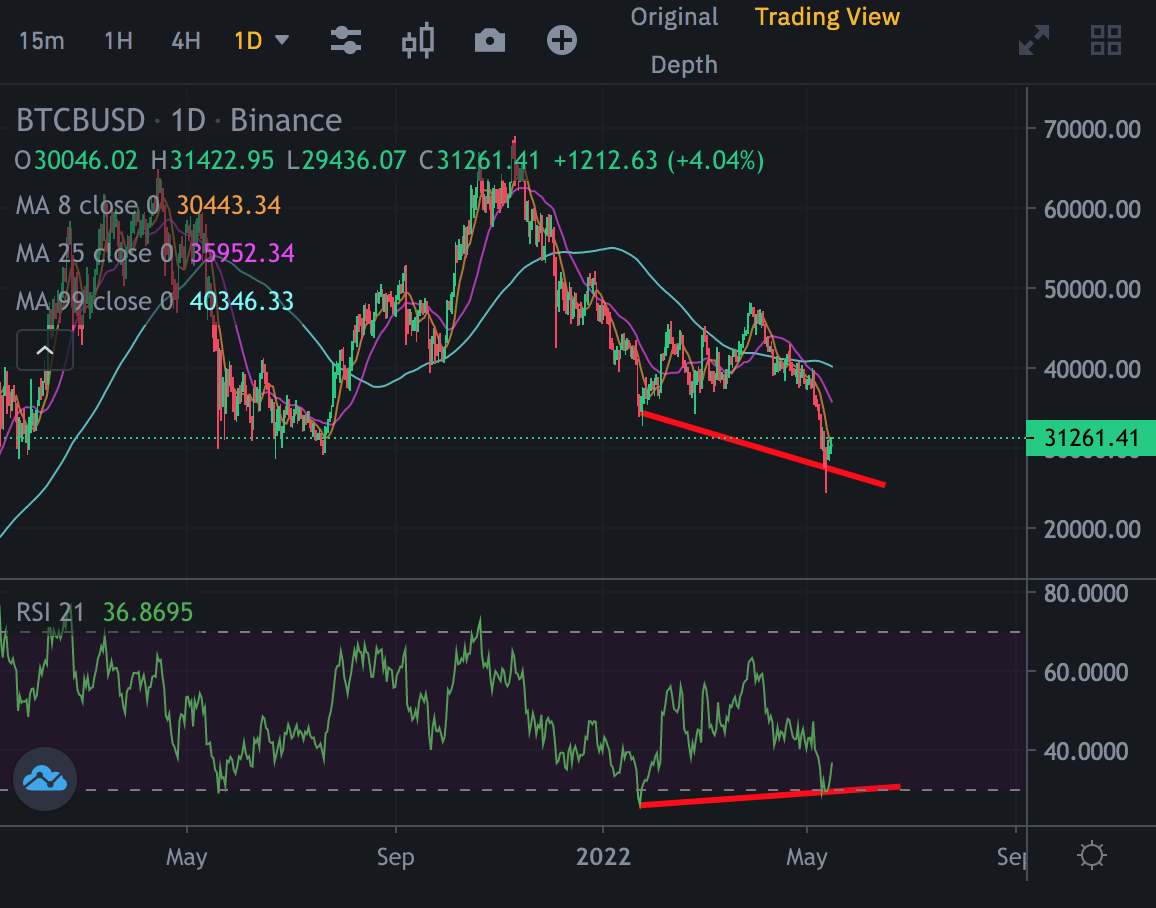
- MACD Indicator is reversing in daily Bitcoin price chart.
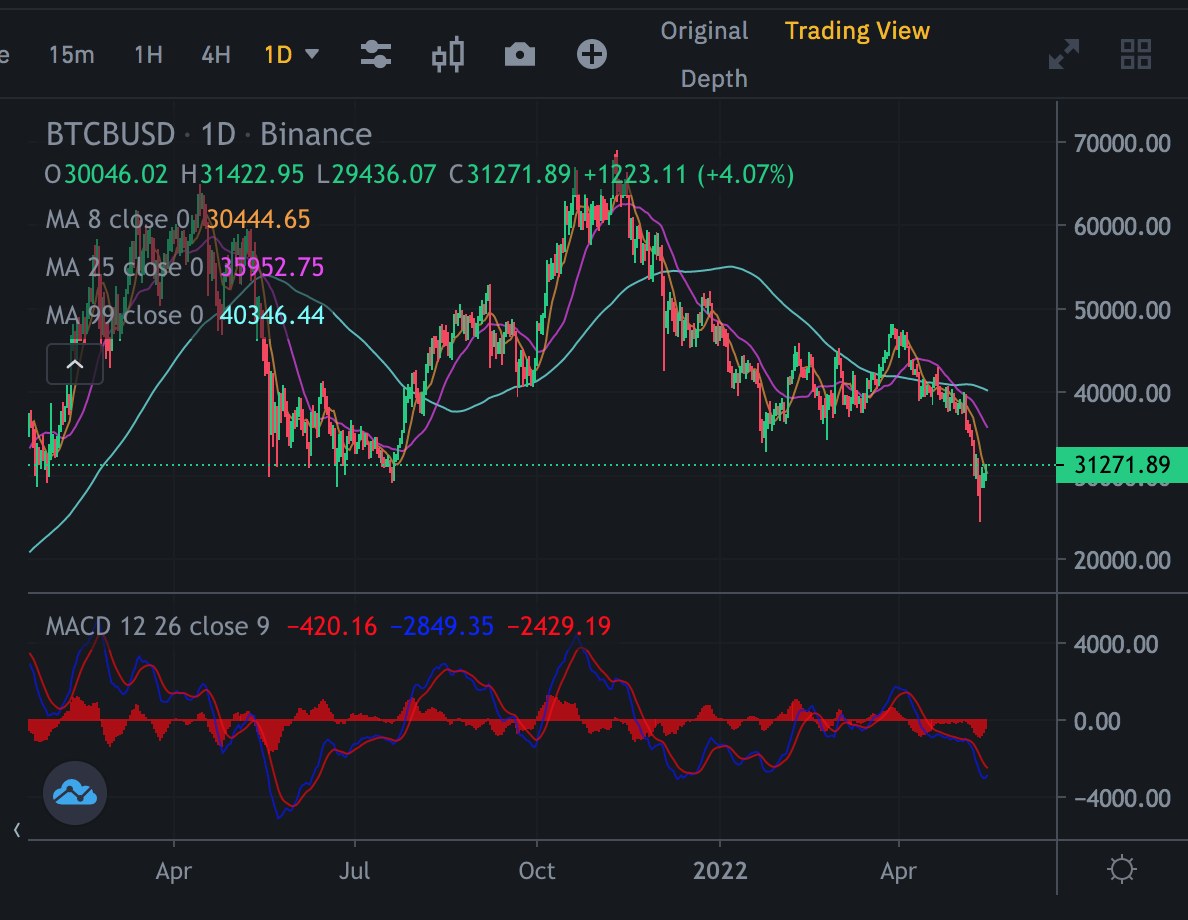
- There is positive divergence in RSI Indicator. Price should go up!
These are the reason for green candle in next week..
We will see green candle in next week!
Posted Using LeoFinance Beta
0
0
0.000
View or trade
BEER.Hey @chorock, here is a little bit of
BEERfrom @pixresteemer for you. Enjoy it!Do you want to win SOME BEER together with your friends and draw the
BEERKING.Congratulations @chorock! You have completed the following achievement on the Hive blockchain and have been rewarded with new badge(s):
You can view your badges on your board and compare yourself to others in the Ranking
If you no longer want to receive notifications, reply to this comment with the word
STOPLet there be green then
Posted using LeoFinance Mobile