Hive Internal Market Report - 08.02.22

This report is based on placement of limit orders and the subsequent trades that followed. The report includes embedded information that was taken from the DEX datastore for the 08/02/2022. The aim of this report is to help provide the community insights on what's happening via the internal market of Hive.
We believe that the following data is the first of its kind however we’re open for comments, feedback and requests for future updates from the Hive community.
OK Let's begin.
Trading summary
| Date | BUY | COST($) | SELL | PAID($) | Volume | turnover($) | Net Position |
|---|---|---|---|---|---|---|---|
| 08/02/2022 | 20997 | 24824 | 10886 | 13072 | 31883 | 37896 | 0.34 |
Buying & Selling of HIVE via the Internal exchange
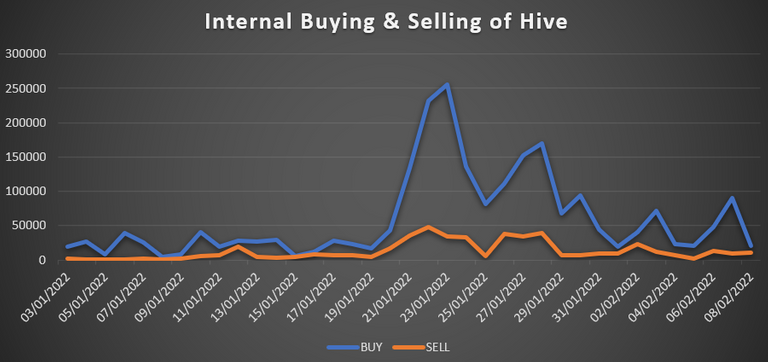
| Date | BUY | SELL |
|---|---|---|
| 08/02/2022 | 20997 | 10886 |
Volume of Hive traded (total Buy + Sell)
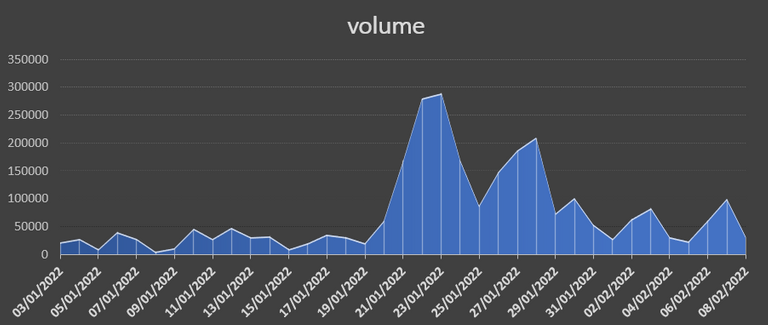
| Date | volume |
|---|---|
| 08/02/2022 | 31883 |
Buy / Sell Ratio
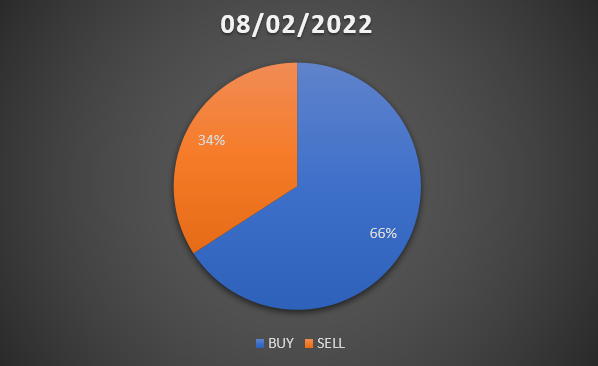
The percentage of trades that were either a ‘buy’ or ‘sell’
Average price paid by buyers of Hive
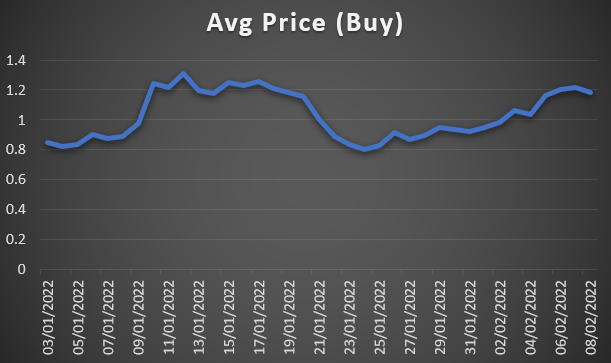
| Date | BUY | COST($) | Avg Price |
|---|---|---|---|
| 08/02/2022 | 20997 | 24824 | 1.18 |
Average Price received by sellers of Hive
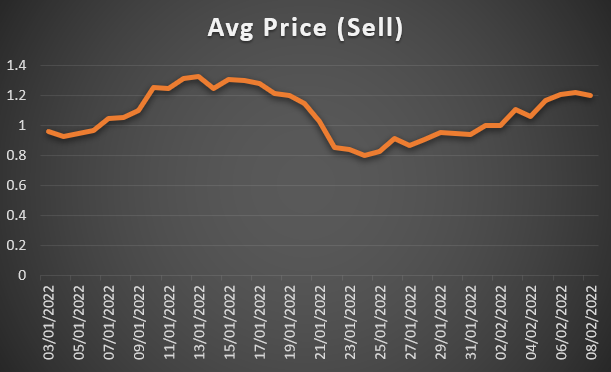
| Date | SELL | PAID($) | Avg Price |
|---|---|---|---|
| 08/02/2022 | 10886 | 13072 | 1.20 |
Largest traders on the 08/02/22 by volume
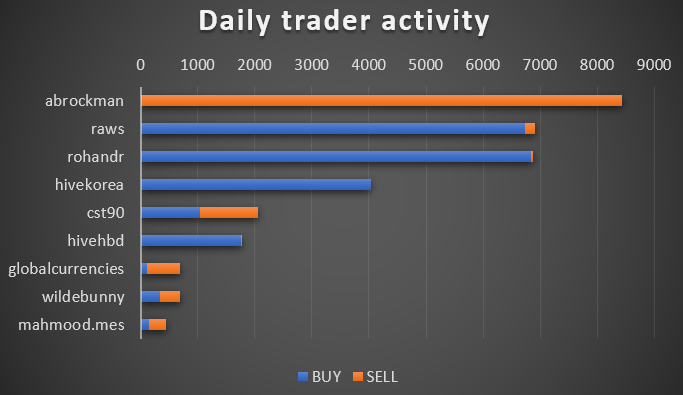
| Account | BUY | SELL | volume | Net Position |
|---|---|---|---|---|
| @abrockman | 8431 | 8431 | 1 | |
| @cst90 | 1032 | 1028 | 2061 | 0.50 |
| @globalcurrencies | 119 | 577 | 696 | 0.83 |
| @hivehbd | 1759 | 4.326 | 1763 | 0 |
| @hivekorea | 4029 | 4029 | 0 | |
| @mahmood.mes | 150 | 295 | 445 | 0.66 |
| @raws | 6733 | 171 | 6904 | 0.02 |
| @rohandr | 6831 | 37 | 6867 | 0.01 |
| @wildebunny | 344 | 343 | 687 | 0.50 |
Largest traders over the last 30 days
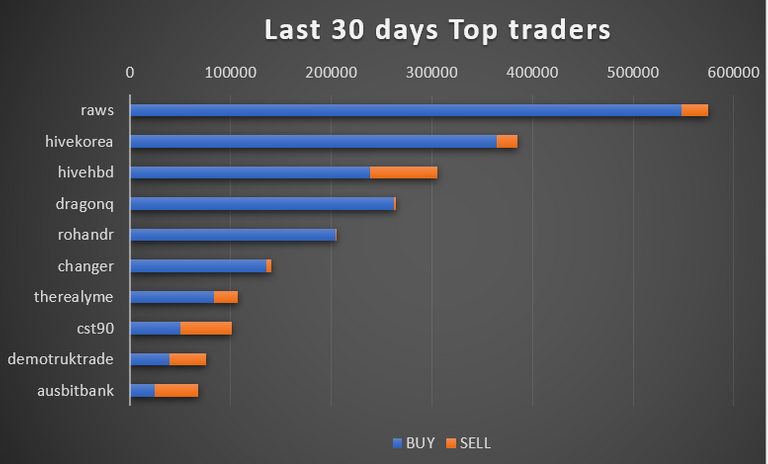
| Account | BUY | SELL | volume | Net Position |
|---|---|---|---|---|
| @raws | 548386 | 25846 | 574231 | 0.05 |
| @hivekorea | 364195 | 20872 | 385067 | 0.05 |
| @hivehbd | 238994 | 66224 | 305218 | 0.22 |
| @dragonq | 261835 | 2459 | 264294 | 0.01 |
| @rohandr | 204500 | 977 | 205476 | 0.00 |
| @changer | 135860 | 4526 | 140386 | 0.03 |
| @therealyme | 83665 | 23244 | 106910 | 0.22 |
| @cst90 | 50423 | 50253 | 100675 | 0.50 |
| @demotruktrade | 38902 | 36433 | 75335 | 0.48 |
| @ausbitbank | 24702 | 42830 | 67532 | 0.63 |
Note: when a participant is placing an order and a counter party is one classed as ‘market maker’, the trade is being taken into consideration in the analysis of this report. For example (MM) places order to sell 10k Hive, if the trade includes an actual participant and not another MM then the traded data is part of the calculation.
By definition all trades have an owner that placed the order and a counter party. If either of them is a real participant, then the trade is being taking into consideration.
**Placement **is calculated by total limit orders created (not necessarily filled) in a given trading date.
Net position ratio for internal market
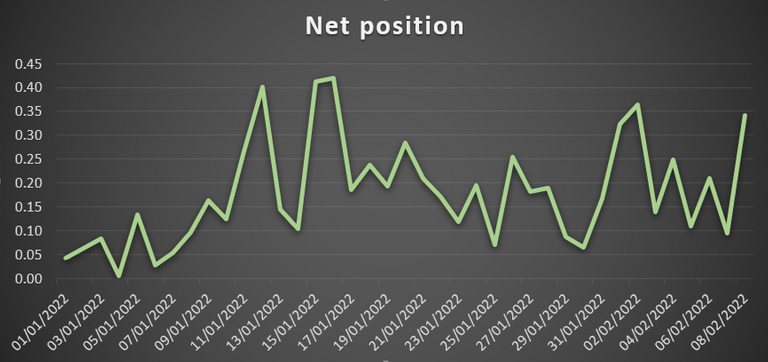
| Date | Net position |
|---|---|
| 08/02/2022 | 0.34 |
The Net position ratio is calculated by number of sell/ total of sell + buy.
A ratio close to 0 indicates a tendency to go long whereas a ratio close to 1 indicates a short tendency. A ratio of 0.5 indicates is a balance of buying and selling Hive in a given trading date.
Thank you for reading the trading report, please send over any questions / feedback you may have and follow the account for the latest updates.
Chewsk1
I am also in this group, I do not believe it
https://twitter.com/realtalkerz/status/1491361001391808520
The rewards earned on this comment will go directly to the person sharing the post on Twitter as long as they are registered with @poshtoken. Sign up at https://hiveposh.com.