El coste de oportunidad

Imagen obtenia de Pixabay y editada con Canva*
El coste de oportunidad es el valor de bienes y servicios que renunciamos para adquirir otros. Dado que los recursos son escasos, la opción de cubrir una necesidad implica dejar de satisfacer otra, lo que implica un coste de oportunidad. Dicho coste puede medirse en dinero , tiempo, o en otros bienes. Al igual que las personas(familias) , las empresas también se enfrentan a la necesidad de elegir, así como la economía de un país (estado).
Ej:si se decide destinar mas recursos a la agricultura que la industria , se esta renunciando a la oportunidad de obtener mas productos industrializados. Estos productos a los que renunciamos (productos industriales)representan el coste de oportunidad de la producción agraria.
y con esto entramos a ver que es:
La frontera de posibilidades de producción (FPP)
la frontera de posibilidades de producción nos presenta la máxima producción de bienes y servicios que pueden obtener una empresa o una sociedad , con los recursos y la tecnología que posee.
Opportunity cost is the value of goods and services that we give up in order to acquire others. Since resources are scarce, the choice to satisfy one need means giving up another, which implies an opportunity cost. This cost can be measured in money, time, or other goods. Like individuals (families), companies also face the need to make choices, as does the economy of a country (state).
E.g. if you decide to allocate more resources to agriculture than to industry, you are giving up the opportunity to get more industrialised products. These products that we renounce (industrial products) represent the opportunity cost of agricultural production.
And with this we come to see what it is:
The production possibilities frontier (PPF).
The production possibilities frontier presents the maximum production of goods and services that a company or a society can obtain with the resources and technology it possesses.
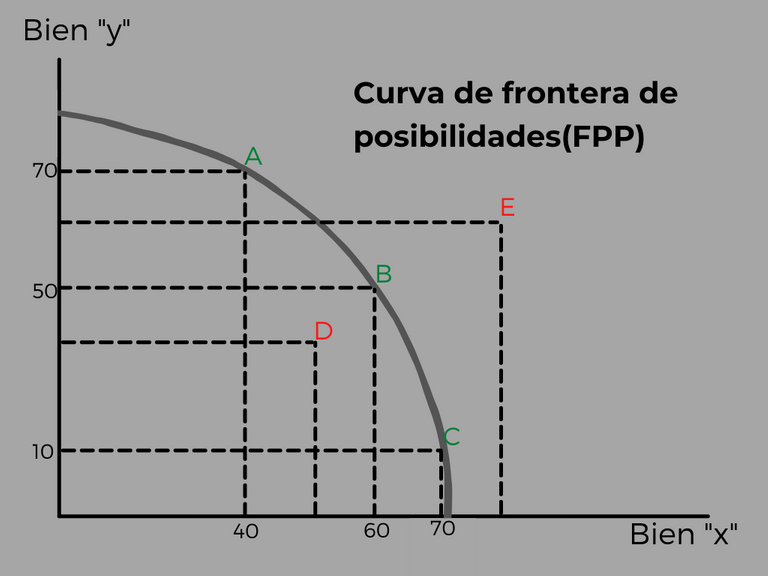
Imagen creada con Canva
Ej: Supongo que una empresa produce 2 bienes: "x" e "y" .Si todos los recursos se emplean para producir "x" , no se podrá producir nada de "y", luego , el coste de oportunidad de producir la máxima cantidad de "x" es no producir "y". De mismo modo ocurrirá si utilizamos todos los recursos para fabricar "y", no se podrá fabricar ninguna unidad de "x". El coste de oportunidad es no producir "x".
Lo normal es que no llegue a estas situaciones extremas y se produzca una cierta cantidad de "x" y de "y según los recursos y la tecnología existente. Las posibles combinaciones , se representan en la curva "FPP".
Por ejemplo: el punto "A" nos indica que podemos producir 70 de "y" y 40" de "x" y así en cada punto de la curva.
El análisis de la FPP nos sirve para comprender el concepto de coste de oportunidad. Pasar de una comvinación eficiente a otra , implica necesariamente , un sacrificio, dado que si queremos aumentar la producción de un bien , hemos de renunciar a parte de la producción de otro. Todas las convinaciones de bienes que se sitúan en la curva FPP , representan el uso eficiente de los recursos productivos dada la tecnología existente , donde los recursos se están empleando de la mejor forma posible , no existiendo recursos ociosos.
Todos los puntos situados en el interior de la curva (como el punto D) indica un nivel de ineficiencia o un mal empleo de los recursos. Los puntos situados en el exterior de la curva , como el punto E , expresan la imposibilidad de producir , porque no hay recursos ni tecnología para ello.
Después toda esta información , espero que los conceptos hayan sido de utilidad tanto para aplicarlo en vuestras finanzas y en vuestra vida, espero que os estén gustando mis publicaciones y seguiré ampliando este tema mañana, ¡Un saludo!👋
If all resources are used to produce "x", no "y" can be produced, then the opportunity cost of producing the maximum amount of "x" is not to produce "y". Similarly, if all resources are used to produce "y", no units of "x" can be produced. The opportunity cost is not to produce "x".
Normally, it does not reach these extreme situations and a certain amount of "x" and "y" is produced according to the existing resources and technology. The possible combinations are represented in the "PPF" curve.
For example: point "A" indicates that we can produce 70 of "y" and 40 of "x" and so on at each point of the curve.
The analysis of the PPF helps us to understand the concept of opportunity cost. Moving from one efficient combination to another necessarily implies a sacrifice, since if we want to increase the production of one good, we have to give up part of the production of another. All the combinations of goods that lie on the PPP curve represent the efficient use of productive resources given the existing technology, where resources are being used in the best possible way, with no idle resources.
All points on the inside of the curve (such as point D) indicate a level of inefficiency or misuse of resources. Points located on the outside of the curve, such as point E, express the impossibility to produce, because there are no resources or technology to do so.
After all this information, I hope that the concepts have been useful to apply in your finances and in your life, I hope you are liking my publications and I will continue to expand this topic tomorrow, best regards!👋
Congratulations @certrading! You have completed the following achievement on the Hive blockchain and have been rewarded with new badge(s) :
Your next target is to reach 3500 upvotes.
You can view your badges on your board and compare yourself to others in the Ranking
If you no longer want to receive notifications, reply to this comment with the word
STOPSu post ha sido valorado por @ramonycajal