Hive Statistics – 2022.01.18
Welcome to the daily analytical report about the Hive blockchain.
All the information presented in this report is based on the data collected from the blockchain until 2022-01-18 midnight UTC. This report aims to provide you with a clear view of what is happening on the Hive blockchain.
 Este post está traducido al español - aquí
 Dieser Beitrag ist ins Deutsche übersetzt - hier
 Une version en français de ce post est disponible - ici
1. New users

This chart shows the number of newly registered users on the blockchain and how many of them became active. The chart is kind of dynamic! A user can register one day and become active a few days later. Therefore, the number of active users on a specific date may change from day to day.
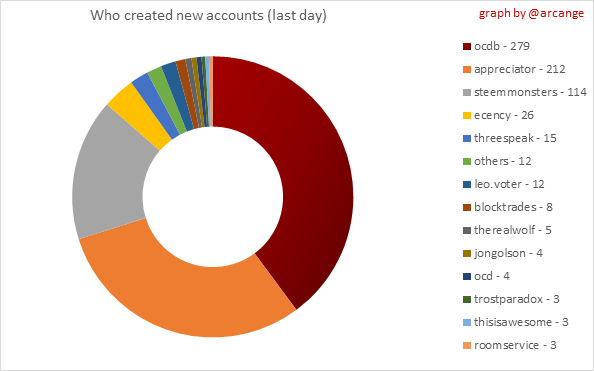 | 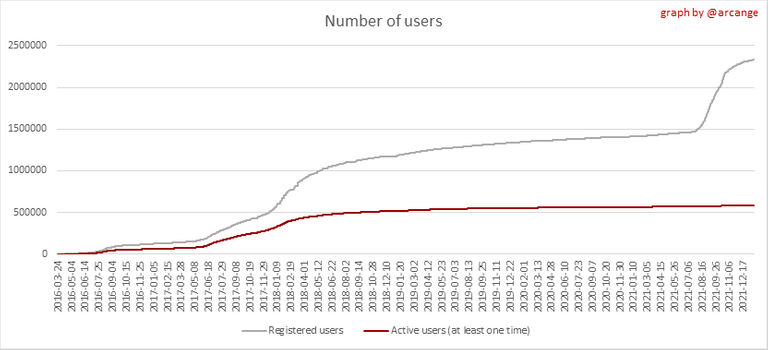 |
These two graphs show who created new accounts during the last day and the total number of registered accounts. The red line shows how many of them have been active at least once (active meaning publishing a post, commenting or voting). They are included even if they become inactive later.
2. Active users
 |  |

These graphs show the activity of users over time and in more detail the last 30 days. In these graphs, "active users" are those performing any type of transaction on the blockchain.
The last graph is a monthly summary of the active users. Be careful when interpreting the value of the last column which can be much lower if the end of the month has not yet been reached.
3. Apps & (d)Apps

This graph shows which applications are most used to publish posts and comments. Please note that the same user can use several different applications.

This graph shows which applications generate the most activity (custom_json operations) on the blockchain.
4. Posts And comments
 |  |
These graphs show the evolution of posts and comments for the whole blockchain lifetime and the last 30 days.
5. Curation
 |  |
These graphs show the evolution of curation (upvotes) for the whole blockchain lifetime and the last 30 days.
6. Daily transactions
![]()
These graphs show the number of transactions per day, and the highest number of transactions per block, the average number of transactions per block, and the number of transactions per block for the last 48 hours. This gives you an idea of the whole activity on the blockchain.
![]()
This graph shows the distribution of the top 10 types of transactions by number of operations performed on the blockchain.
7. Communities and Tags

This graph shows the communities with the most subscribers.
 |  |
These graphs show the most active communities by number of posts (blockchain lifetime and last day).
 | 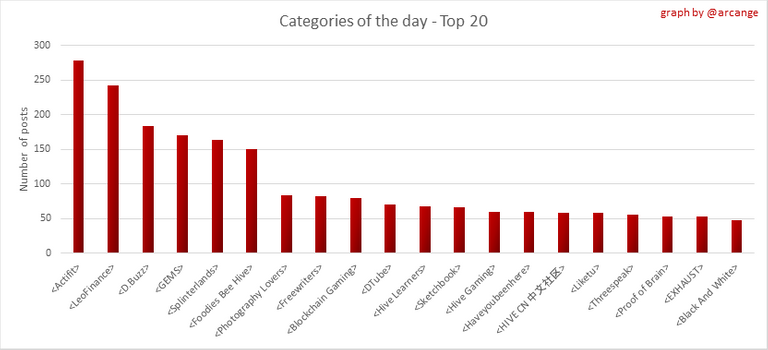 |
These graphs show which main tags have been the most used for publishing posts for the whole blockchain lifetime and the last day.
8. Distribution
 |  |  |  |  |
| < ~542 HP | >= ~542 HP | >= ~5415 HP | >= ~54143 HP | >= ~541430 HP |
 |  |
These graphs show the number of users according to their Hive Power. The left graph shows the distribution without taking into account any delegation made or received by the accounts. The right graph takes into account delegation, adds received HP delegation and subtracts given HP delegation.
The grey part of each column indicates how many accounts are inactive (those who have not posted, commented or voted the last 30 days).
 |  |
This graph shows the distribution of Hive Power cumulated per account level. The left graph shows the distribution without taking into account any delegation made or received by the accounts. The right graphs take into account delegation, adds received HP delegation and subtracts given HP delegation.
The grey part of each column indicates unused Hive Power by inactive accounts (see above the definition of inactive).
Below each column, you will also see a ratio to all existing Hive Power.
9. Payouts

This graph shows the highest reward paid on a post (or comment) for the last 30 days.
 |  |
These graphs show the total of the distributed payout (posts and comments) for each day.
 |  |
These graphs show the average and median payout per post for the last 30 days.
I hope you find those stats useful. If you would like to see additional stats, feel free to drop me a comment. Your feedback is welcome.
Thanks for reading.
Check out my apps and services


View or trade
BEER.Hey @arcange, here is a little bit of
BEERfrom @pixresteemer for you. Enjoy it!Learn how to earn FREE BEER each day by staking your
BEER.in my opinion, the third point shows how important Splinterlands is to HIVE
Sure thing
Can you break down what exactly these Splinterlands jsons are doing?
What are our Hive Blocks being filled with @arcange?
Do these represent every action taken, game played, or NFTs being swapped? All of the above?
With HiveIsBeautiful we can see that any particular block is composed of as your graph suggests, 88% splinterlands transactions. I have a booster pack and I play occasionally but I have noticed the huge increase in activity on Hive thanks to new Splinterlands users. Are there more detailed statistics available about Splinterlands posted anywhere or could you tell us what you can about how big this game is! How many booster packs or how many dark energy crystals would be interesting to see over time.
On HiveBlocks we can see some random Splinterlands transactions, and what do they say?
1 https://hiveblocks.com/tx/f4fab078ea250ac8ed0e200b998fd0e043dd217b
2 https://hiveblocks.com/tx/05739ec55d636952cf36293cdf18302b33e394d7
3 https://hiveblocks.com/tx/8954df6f77054729f28728f5ce7d5d5efa7db14c
These three appear to be
1. Using Gift Cards?
2. Daily quest objective?
3. This one is more complex, guild related?
And there are many more types of Splinterlands jsons,
neldrin Splinterlands list cards for sale on the market
alvina339 Splinterlands started a daily quest
nla085 Splinterlands list cards for sale on the market
steedos Splinterlands list cards for sale on the market
mila-tequila Splinterlands entered into match queue
bunn224 Splinterlands gift cards to bunn249
Is there any information somewhere about how many NFTs are being created and traded on Hive, not just Splinterlands but also in new outpost communities? And I have other questions like, are they fungible? Can I see ALL my NFTs somewhere, other than https://nftm.art/ ? @peakd needs a wallet page that shows all NFTs associated with any account and links to where to view them.
I would like to learn more about how this works on the blockchain level, as it is very interesting. I want to learn how to use jsons in simple games that I have made so they can run on Hive too. Splinterlands is a fascinating example of what is possible. I am interested in any statistics you may be able to find.
I think the stats you are looking for are available here: https://peakmonsters.com/dashboard
Providing such stats requires parsing and analyzing every custom_json ops because you have to filter out invalid ones (custom_json are non-consensus operations, meaning it can contain anything including trash). Such work is out of the scope of this post.
No pressure I was just curious. Thanks for the direction I will look at the site you shared.