Hive Financial Statistics – 2024.01.09

Welcome to the daily financial report about the Hive blockchain.
All the information presented in this report is based on the data collected from the blockchain until 2024-01-09 midnight UTC. This report aims to provide you with a clear view of what is happening on the Hive blockchain.
 Este post está traducido al español - aquí
 Dieser Beitrag ist ins Deutsche übersetzt - hier
 Une version en français de ce post est disponible - ici
1. Price
 | 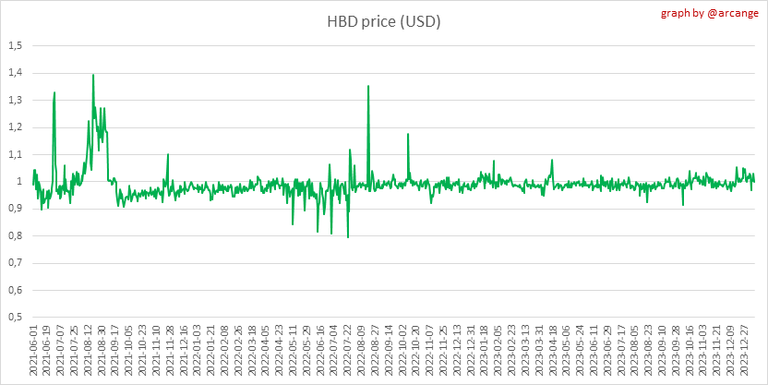 |
These graphs show the evolution of prices in USD for HIVE and HBD.
2. Supply
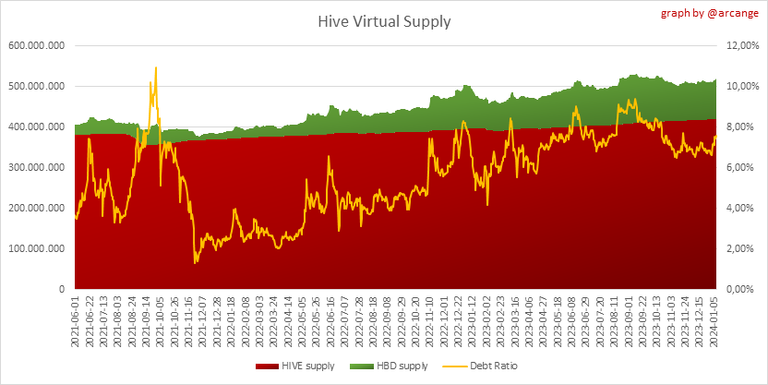
This graph shows the evolution of HIVE virtual Supply. The virtual supply is the sum of HIVE supply (liquid and staked HIVE) and HBD supply (converted into HIVE).
The graph also displays the debt ratio (HBD supply / HIVE virtual supply). Keep in mind that since hardfork 24 funds in the treasury (@hive.fund HBD balance) don't count towards the HBD debt ratio.
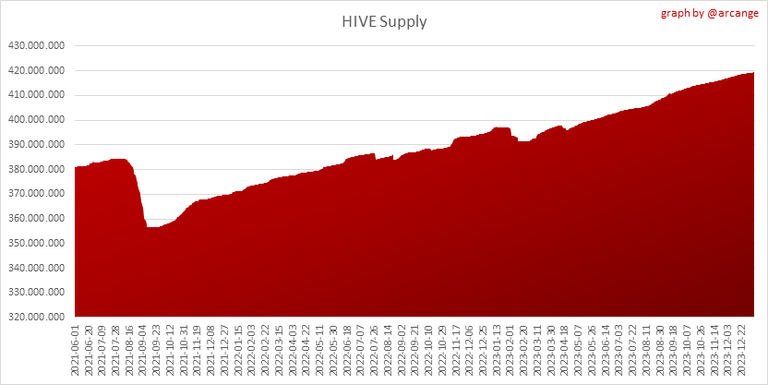 | 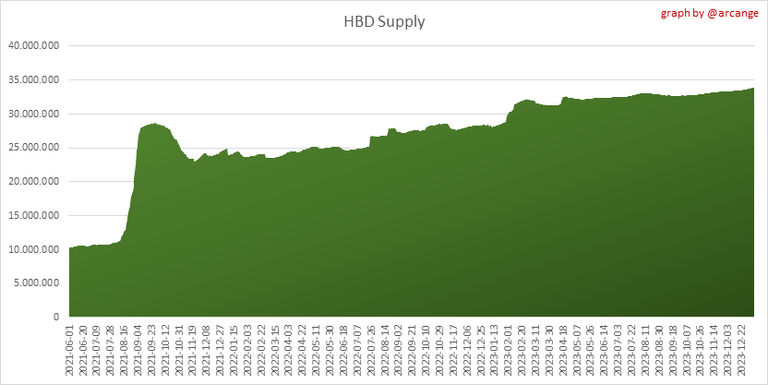 |
These graphs show the evolution of the HIVE Supply (both liquid and staked) and the HBD supply.
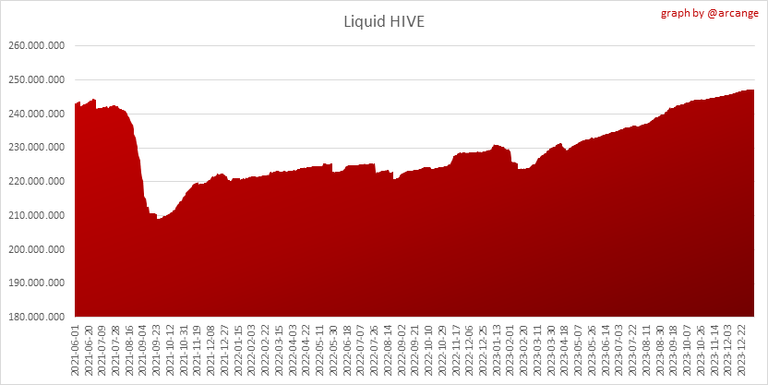 | 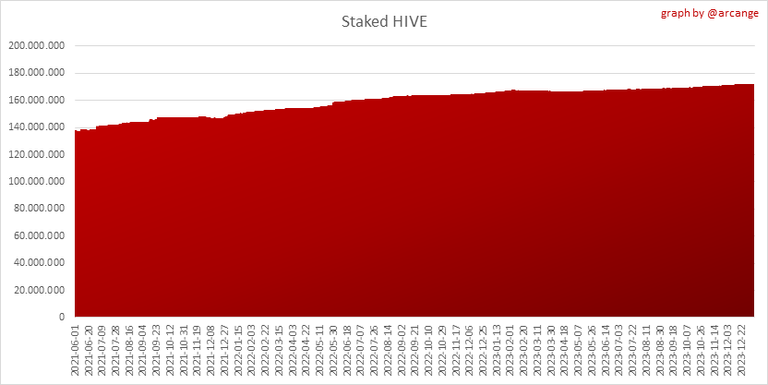 |
These charts show the evolution of the liquid HIVE and the staked HIVE (Hive Power).

This graph shows the overall Hive tokens distribution.
3. HBD Savings

| Account | Deposit | Account | Withdrawal |
|---|---|---|---|
| @ijatz | 587.359 HBD | @hbd-promo | 7,000.000 HBD |
| @goldrooster | 507.401 HBD | @h8-vakili | 3,000.000 HBD |
| @anna-newkey | 458.571 HBD | @straykat | 462.296 HBD |
| @crypt0gnome | 158.421 HBD | @aequi | 235.651 HBD |
| @notak | 150.000 HBD | @ojamajo | 231.283 HBD |
| @worldfinances | 131.000 HBD | @borislavzlatanov | 200.000 HBD |
| @blrog | 110.444 HBD | @takyarts | 144.309 HBD |
| @odlanier01 | 107.272 HBD | @ssjsasha | 100.426 HBD |
| @zupasteleria | 100.612 HBD | @stayoutorz-fin | 100.000 HBD |
| @ariannamc | 100.000 HBD | @rsstarpro | 100.000 HBD |
This graph shows how much and how many accounts store HBD in savings. The table below shows the topmost HBD deposits and withdrawals of the day.
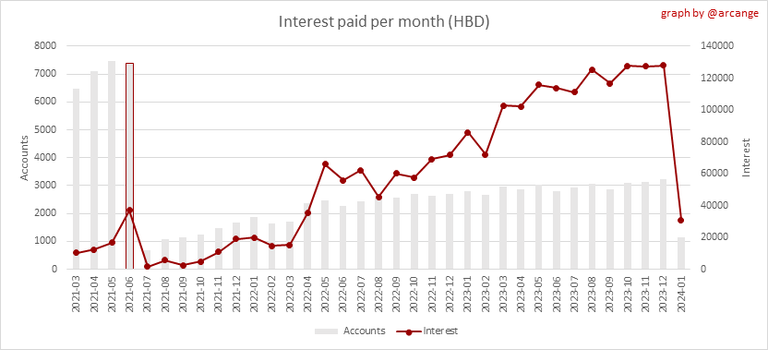
Note: As of 2021-06-30 (HF25) interest is only paid for HBD which are stored in savings.
This chart shows the amount of interest paid each month for holding HBD and how many accounts received such interest.
4. Balances
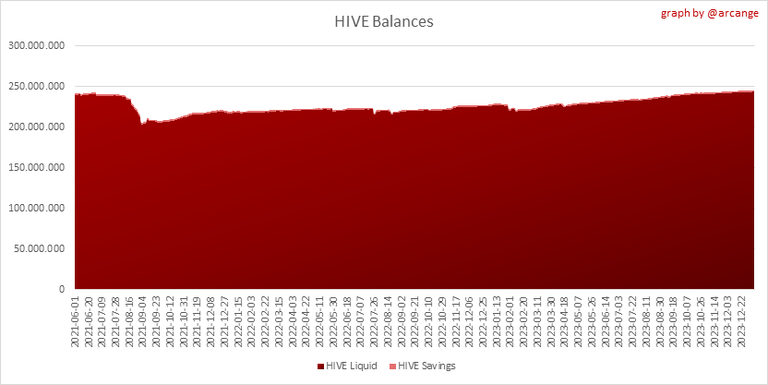
This graph shows the number of HIVE, both liquid and in savings, held by all accounts.
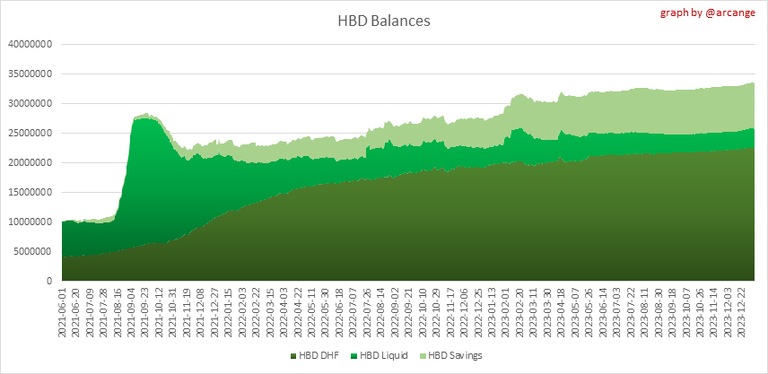
This graph shows the number of HBD, both liquid and in savings, held by all accounts. It also displays the amount of HBD stored in the Decentralized Hive Fund (DHF).
5. Conversions
Note: As a reminder, conversion requests are only finalized after 3 days. It is only then that it is known exactly how many HIVE were burned in return for the HBD received at the time of the conversion request.
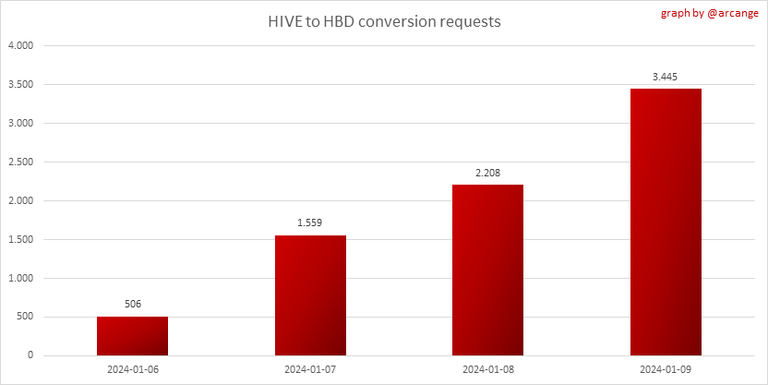
This graph shows the number of HIVE collateralized due to requests to convert HIVE to HBD over the past few days.
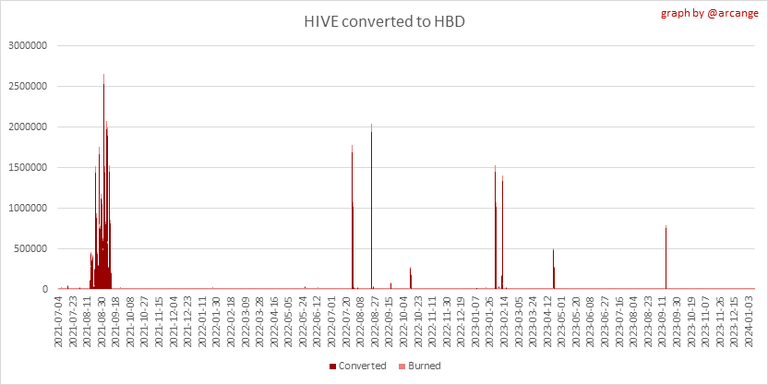 |  |
These graphs show the number of HIVE effectively used by the conversion process (HIVE converted and 5% HIVE fee which is burned) each day and month when requests to convert HIVE to HBD have been finalized.
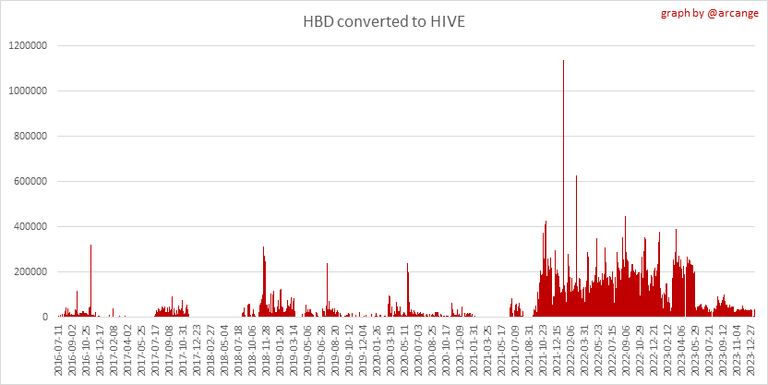 |  |
These graphs show the number of HBD burned, each day and each month, following requests to convert HBD to HIVE.
6. Powerup and Powerdown
| Date | Account | Amount |
|---|---|---|
| 2024-01-09 02:28:09 | @nanosesame | 17,866.475 HIVE |
| 2024-01-09 12:17:51 | @equipodelta | 5,468.150 HIVE |
| 2024-01-09 04:17:12 | @punkteam | 4,255.069 HIVE |
| 2024-01-09 08:03:12 | @lauramica | 3,900.092 HIVE |
| 2024-01-09 07:06:15 | @judyhopps | 3,029.167 HIVE |
| 2024-01-09 11:01:57 | @indayclara | 1,073.058 HIVE |
| 2024-01-09 03:25:27 | @mattsanthonyit | 1,010.904 HIVE |
| 2024-01-09 04:04:48 | @rutablockchain | 1,000.077 HIVE |
| 2024-01-09 07:20:18 | @apoloo1 | 679.373 HIVE |
| 2024-01-09 12:03:00 | @kjl26 | 513.026 HIVE |
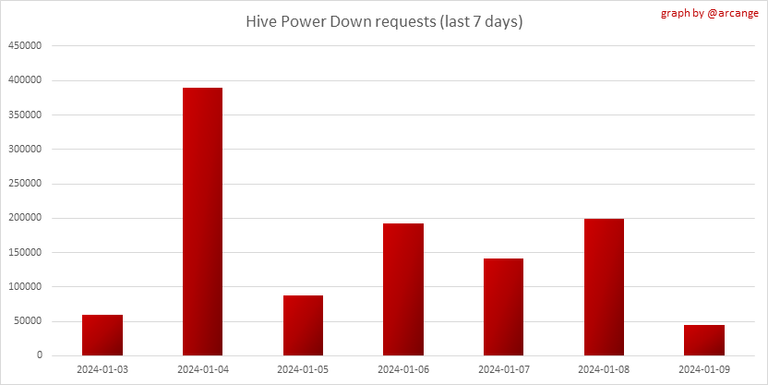
This graph and table show the amount of powerdown initiated over the last 7 days, and the largest initiated on this day.
| Account | Powerup | Account | Powerdown |
|---|---|---|---|
| @emrebeyler | 72,131.423 HIVE | @howo | 7,918.425 HIVE |
| @h8-vakili | 9,275.720 HIVE | @eonwarped | 4,132.356 HIVE |
| @aliento | 1,093.406 HIVE | @nateaguila | 3,850.449 HIVE |
| @catwomanteresa | 1,000.000 HIVE | @nextgen622 | 2,778.200 HIVE |
| @gogreenbuddy | 506.387 HIVE | @city-of-dresden | 2,733.515 HIVE |
| @acactus1013 | 500.000 HIVE | @good-karma | 2,717.866 HIVE |
| @methodofmad | 482.029 HIVE | @russia-btc | 2,079.241 HIVE |
| @numasi | 434.766 HIVE | @knockcrypto | 2,036.084 HIVE |
| @theinkwell | 300.000 HIVE | @gniksivart | 1,557.587 HIVE |
| @xunba | 181.000 HIVE | @stevelivingston | 1,329.412 HIVE |
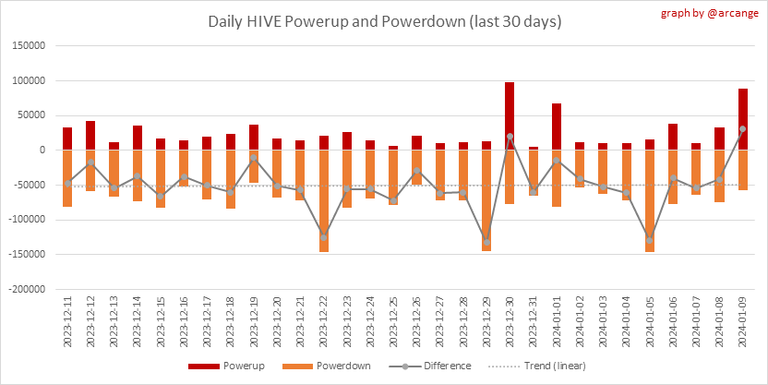
This graph shows the daily HIVE power-up, power-down, and the resulting variation over the last 30 days. The table shows the topmost power-ups and power-downs of the day.
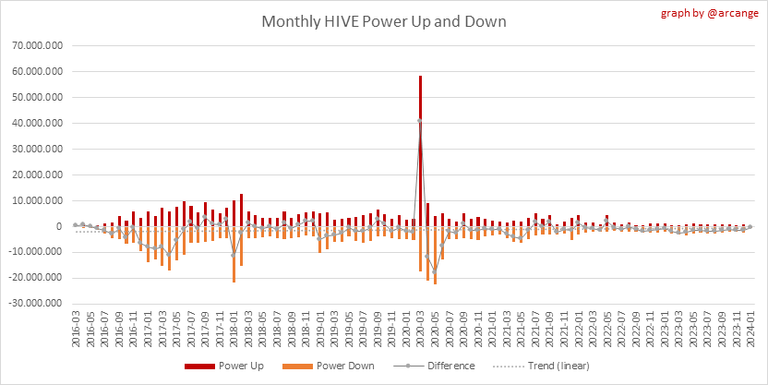
This graph shows the monthly HIVE power-up, power-down and the resulting variation.
Values for the last 3 months
| Period | Powerup | Powerdown | Difference |
|---|---|---|---|
| 2024-01 | 285,388.000 | 687,981.000 | -402,593.000 |
| 2023-12 | 889,719.000 | 2,255,634.000 | -1,365,915.000 |
| 2023-11 | 694,882.000 | 2,014,901.000 | -1,320,019.000 |
7. Transfers
These graphs show the volume (in USD) of HIVE and HBD transferred between accounts.
8. Exchanges
 | 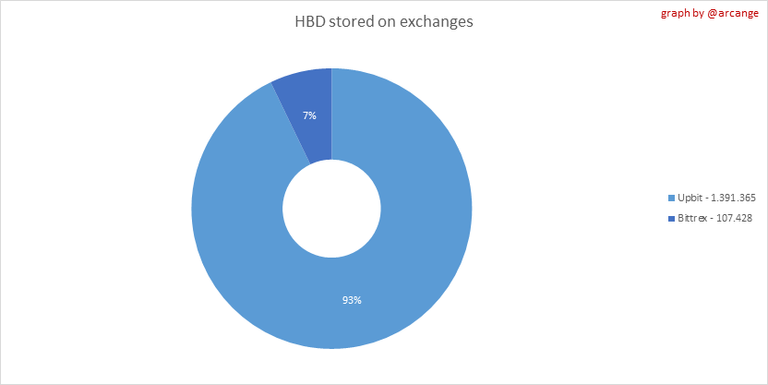 |
These graphs show the amount and distribution of HIVE and HBD stored on the exchanges where they are listed.
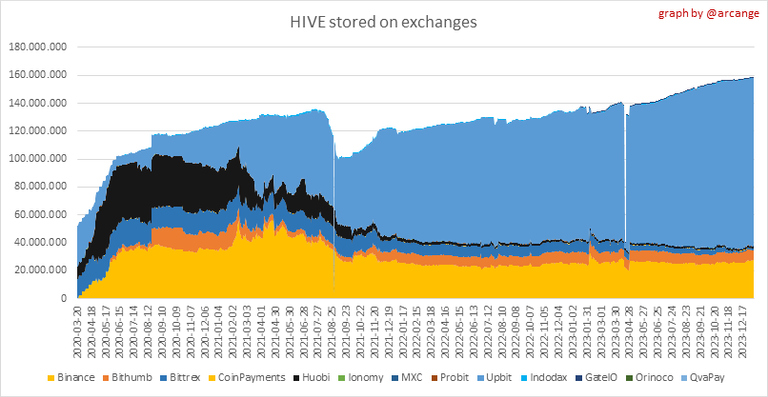 | 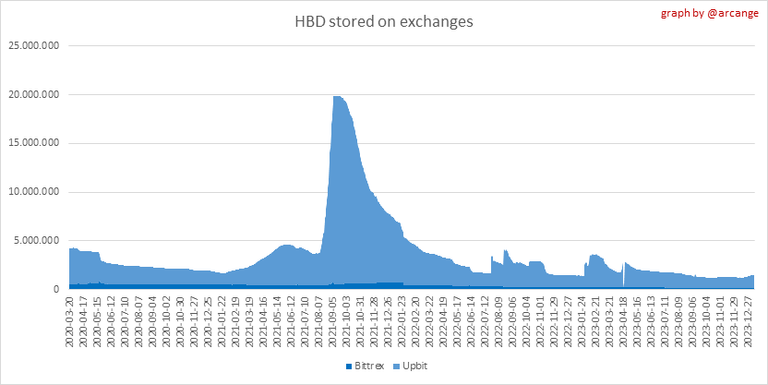 |
These graphs show the daily evolution of HIVE and HBD stored on the exchanges where they are listed.
I hope you find those stats useful. If you would like to see additional stats, feel free to drop me a comment. Your feedback is than welcome.
Thanks for reading.
Check out my apps and services


Thank you for your work, you're doing great!
I think the most moderately exciting stat is the line one the HBD savings. I have so led away a good amount as a regular habit and it really adds up. 20% apr is as good as it gets for the stable coin and is much better than sitting on too much hbd or buying hive at peaks.
Looking at some of those power ups, I really hope I can get to powering up hundreds per month like some of those other people before the token price appreciates to the point that is too expensive. Happy for some nice sideways action in $Hive so I can build my stake!
Thanks again for feeding us this financial perspective to help us build our hive business.
I'm glad to see that you find the stats useful. Indeed
HBD with the current APR is indeed a great way to grow your assets.
Thank you for your feedback and support!
Excellent financial report dear sir I appreciate it