Hive Financial Statistics – 2023.05.24

Welcome to the daily financial report about the Hive blockchain.
All the information presented in this report is based on the data collected from the blockchain until 2023-05-24 midnight UTC. This report aims to provide you with a clear view of what is happening on the Hive blockchain.
 Este post está traducido al español - aquí
 Dieser Beitrag ist ins Deutsche übersetzt - hier
 Une version en français de ce post est disponible - ici
1. Price
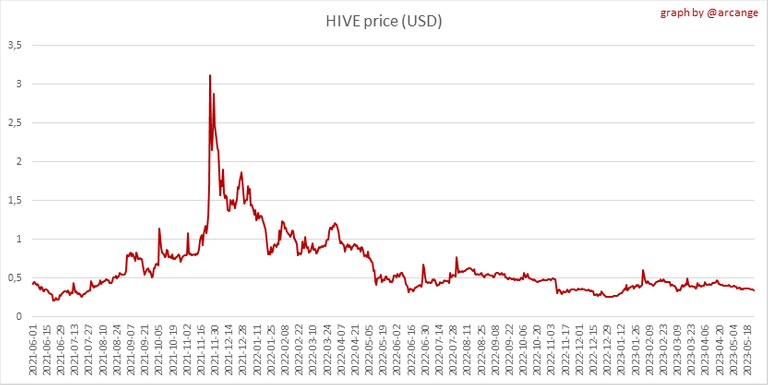 | 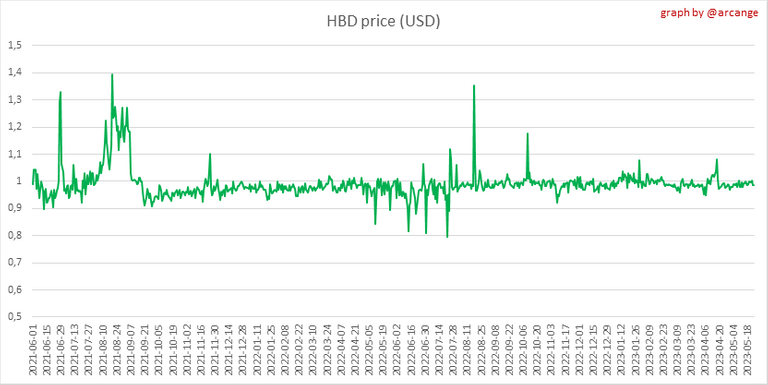 |
These graphs show the evolution of prices in USD for HIVE and HBD.
2. Supply
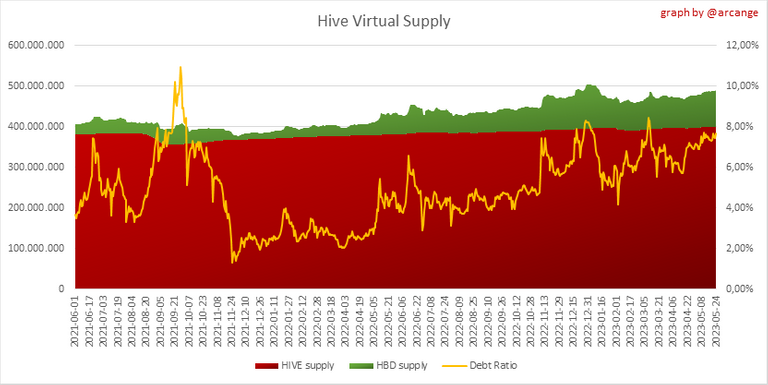
This graph shows the evolution of HIVE virtual Supply. The virtual supply is the sum of HIVE supply (liquid and staked HIVE) and HBD supply (converted into HIVE).
The graph also displays the debt ratio (HBD supply / HIVE virtual supply). Keep in mind that since hardfork 24 funds in the treasury (@hive.fund HBD balance) don't count towards the HBD debt ratio.
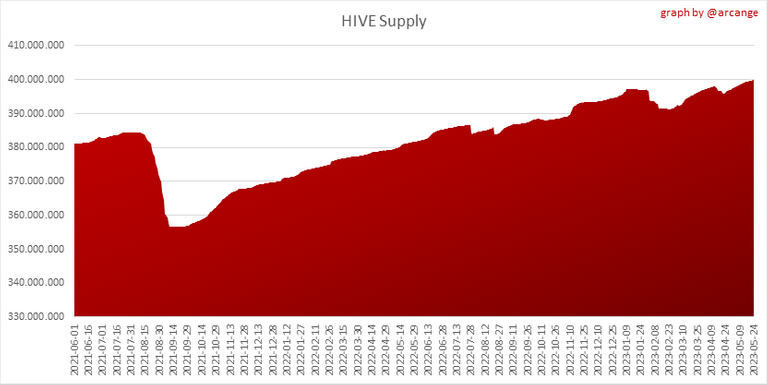 |  |
These graphs show the evolution of the HIVE Supply (both liquid and staked) and the HBD supply.
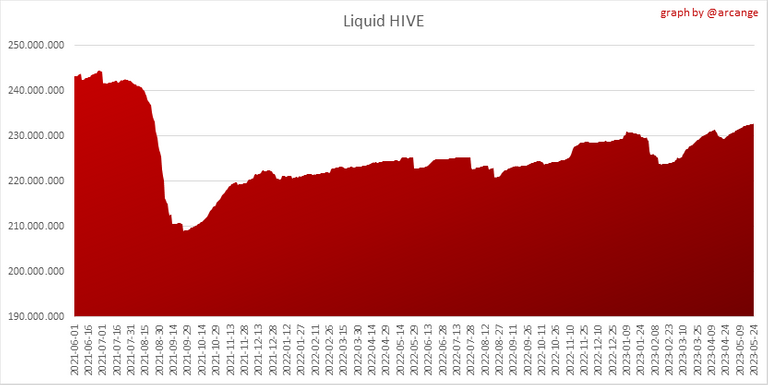 | 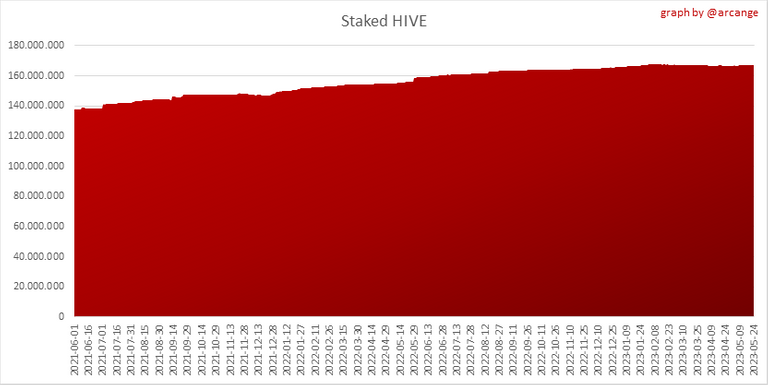 |
These charts show the evolution of the liquid HIVE and the staked HIVE (Hive Power).
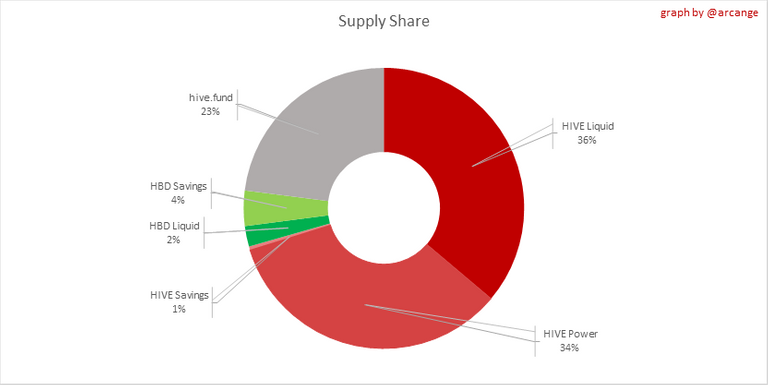
This graph shows the overall Hive tokens distribution.
3. HBD Savings
| Account | Deposit | Account | Withdrawal |
|---|---|---|---|
| @ordinal | 11,023.184 HBD | @hivecreators | 1,500.000 HBD |
| @hiveauth | 324.984 HBD | @sourovafrin | 1,010.000 HBD |
| @hivechain.app | 279.984 HBD | @wilddrumss | 135.036 HBD |
| @kencode | 258.907 HBD | @thanatos25 | 112.015 HBD |
| @mrspointm | 200.000 HBD | @pochocles | 42.715 HBD |
| @tsnaks | 147.000 HBD | @kargul09 | 33.000 HBD |
| @feruz | 131.952 HBD | @freidimar18 | 30.172 HBD |
| @blrog | 114.399 HBD | @eyesonhive | 20.000 HBD |
| @manuelernestogr | 112.205 HBD | @jongolson | 19.276 HBD |
| @ashotep | 100.292 HBD | @young-boss-karin | 11.000 HBD |
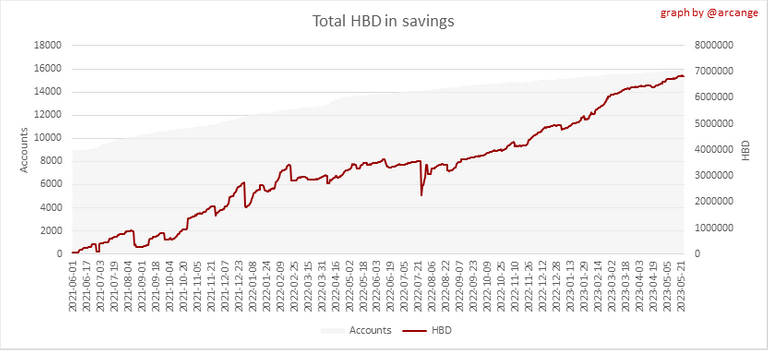
This graph shows how much and how many accounts store HBD in savings. The table below shows the topmost HBD deposits and withdrawals of the day.
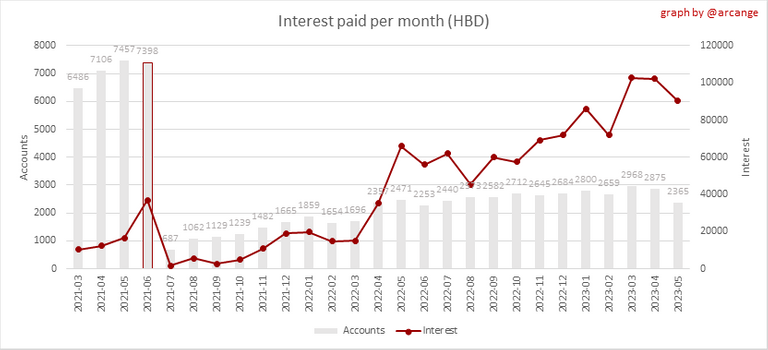
Note: As of 2021-06-30 (HF25) interest is only paid for HBD which are stored in savings.
This chart shows the amount of interest paid each month for holding HBD and how many accounts received such interest.
4. Balances
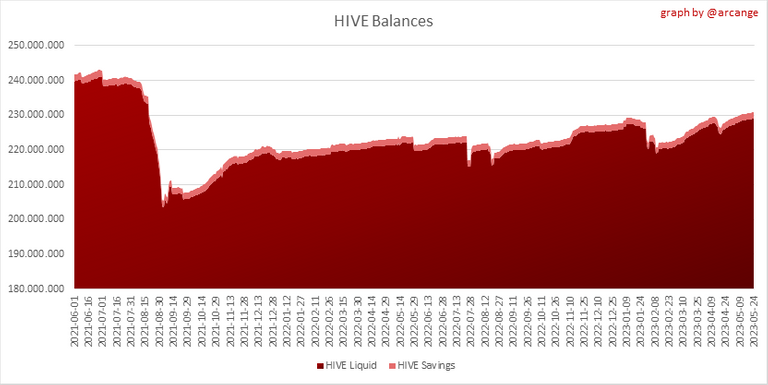
This graph shows the number of HIVE, both liquid and in savings, held by all accounts.
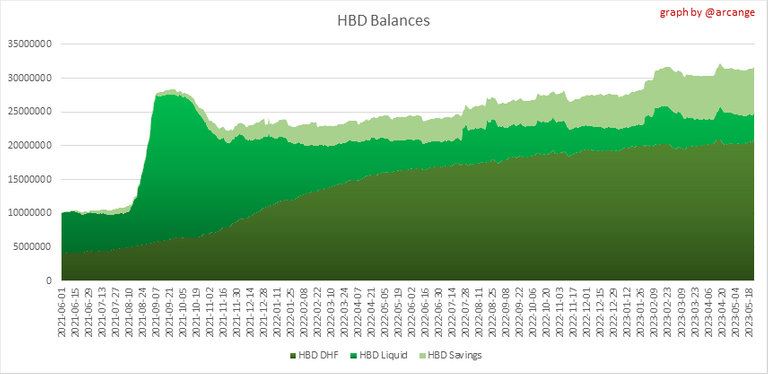
This graph shows the number of HBD, both liquid and in savings, held by all accounts. It also displays the amount of HBD stored in the Decentralized Hive Fund (DHF).
5. Conversions
Note: As a reminder, conversion requests are only finalized after 3 days. It is only then that it is known exactly how many HIVE were burned in return for the HBD received at the time of the conversion request.
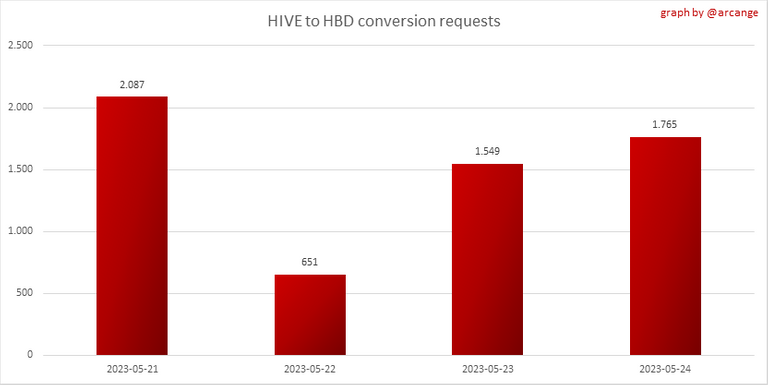
This graph shows the number of HIVE collateralized due to requests to convert HIVE to HBD over the past few days.
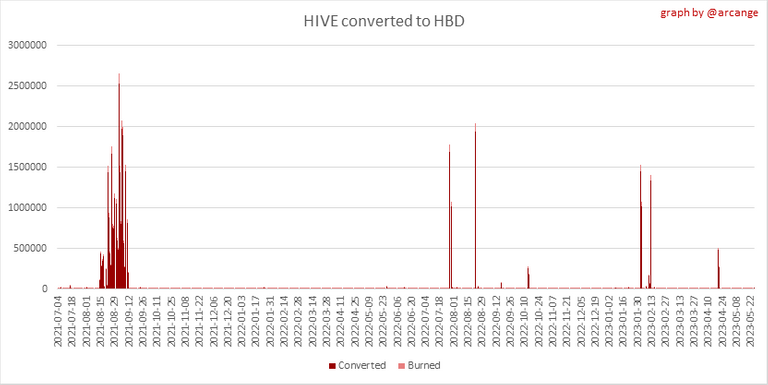 | 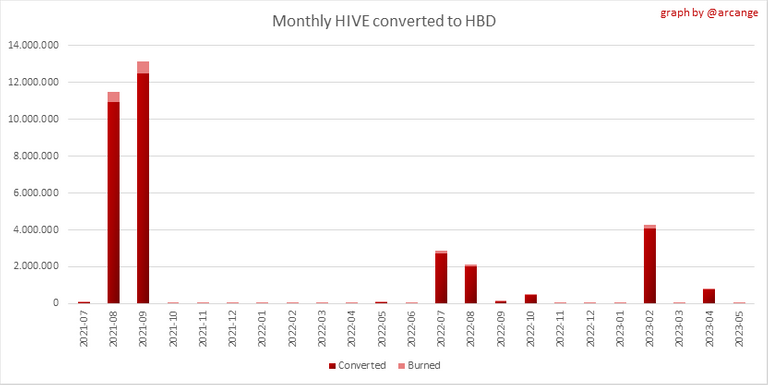 |
These graphs show the number of HIVE effectively used by the conversion process (HIVE converted and 5% HIVE fee which is burned) each day and month when requests to convert HIVE to HBD have been finalized.
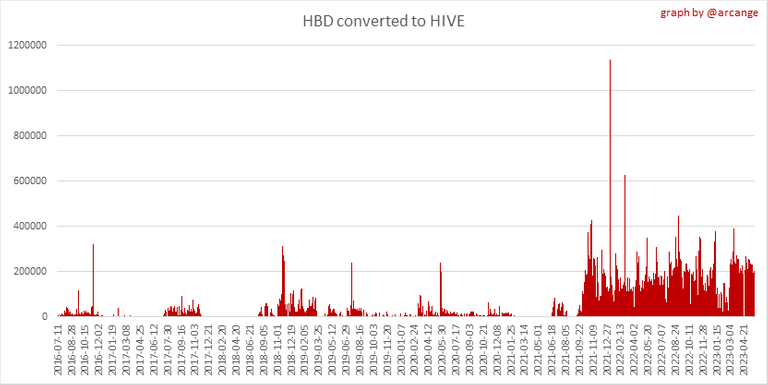 | 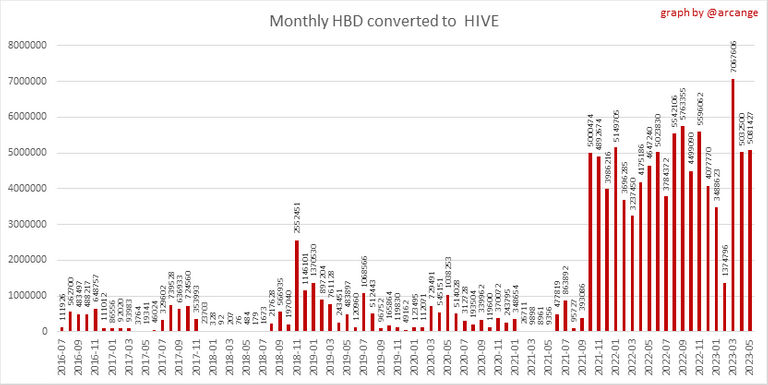 |
These graphs show the number of HBD burned, each day and each month, following requests to convert HBD to HIVE.
6. Powerup and Powerdown
| Date | Account | Amount |
|---|---|---|
| 2023-05-24 01:58:30 | @buildawhale | 167,823.747 HIVE |
| 2023-05-24 07:09:03 | @sagarkothari88 | 8,500.595 HIVE |
| 2023-05-24 07:09:42 | @thehivemobileapp | 8,500.595 HIVE |
| 2023-05-24 12:48:33 | @steempty | 6,500.579 HIVE |
| 2023-05-24 12:05:33 | @ahmetay | 3,900.198 HIVE |
| 2023-05-24 05:16:06 | @lauramica | 3,900.130 HIVE |
| 2023-05-24 06:37:54 | @allcapsonezero | 3,055.668 HIVE |
| 2023-05-24 01:24:48 | @mark3004 | 2,680.124 HIVE |
| 2023-05-24 02:02:48 | @nickydee | 2,390.160 HIVE |
| 2023-05-24 02:20:12 | @nick-nk596 | 1,546.915 HIVE |
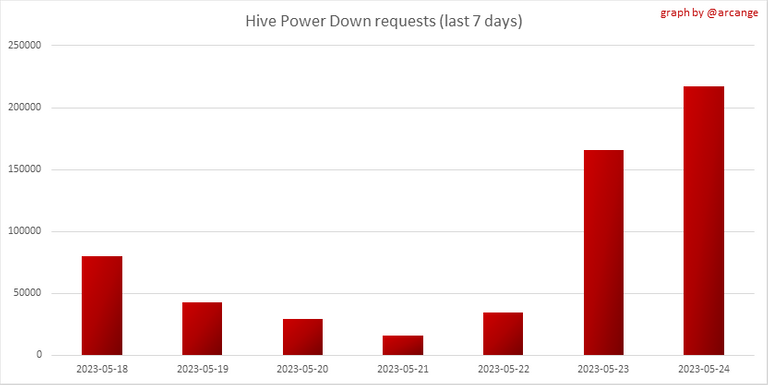
This graph and table show the amount of powerdown initiated over the last 7 days, and the largest initiated on this day.
| Account | Powerup | Account | Powerdown |
|---|---|---|---|
| @maddogtime | 20,000.014 HIVE | @thejohalfiles | 72,064.852 HIVE |
| @emrebeyler | 5,000.042 HIVE | @ocdb | 16,634.518 HIVE |
| @txerritxoa | 1,723.131 HIVE | @xtradition | 5,281.466 HIVE |
| @cooltivar | 731.000 HIVE | @leo.voter | 4,637.106 HIVE |
| @nickelbunker | 500.033 HIVE | @threespeak | 2,793.504 HIVE |
| @tazi | 500.000 HIVE | @steemitboard | 2,267.675 HIVE |
| @demotruk | 484.926 HIVE | @threespeak | 2,194.896 HIVE |
| @ironshield | 455.675 HIVE | @newsflash | 1,596.513 HIVE |
| @jmsansan | 315.194 HIVE | @someguy123 | 1,546.219 HIVE |
| @daveks | 310.513 HIVE | @doikao | 1,542.781 HIVE |
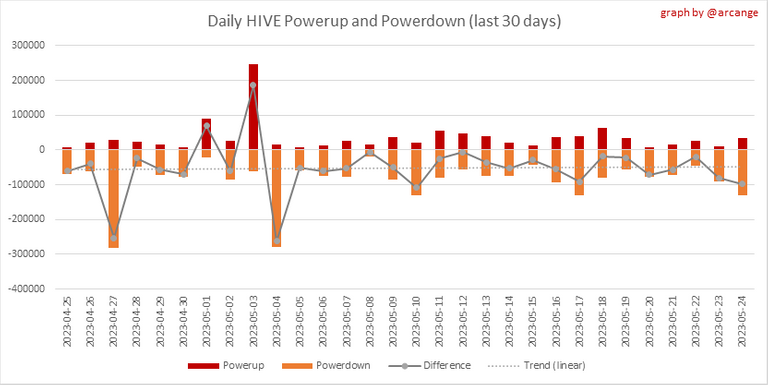
This graph shows the daily HIVE power-up, power-down, and the resulting variation over the last 30 days. The table shows the topmost power-ups and power-downs of the day.
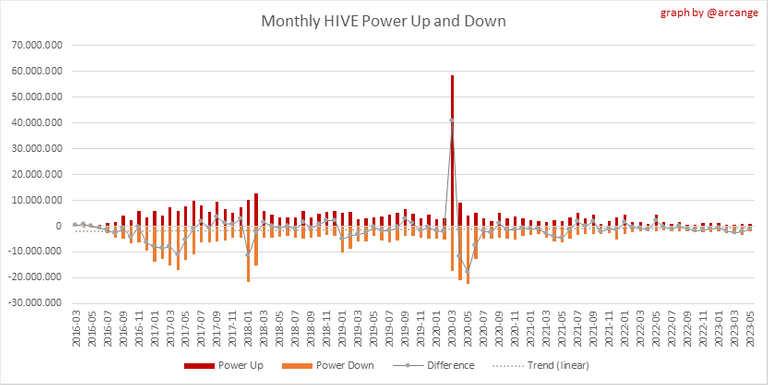
This graph shows the monthly HIVE power-up, power-down and the resulting variation.
Values for the last 3 months
| Period | Powerup | Powerdown | Difference |
|---|---|---|---|
| 2023-05 | 936,554.000 | 1,995,271.000 | -1,058,717.000 |
| 2023-04 | 1,013,557.000 | 3,267,358.000 | -2,253,801.000 |
| 2023-03 | 628,383.000 | 3,155,615.000 | -2,527,232.000 |
7. Transfers
These graphs show the volume (in USD) of HIVE and HBD transferred between accounts.
8. Exchanges
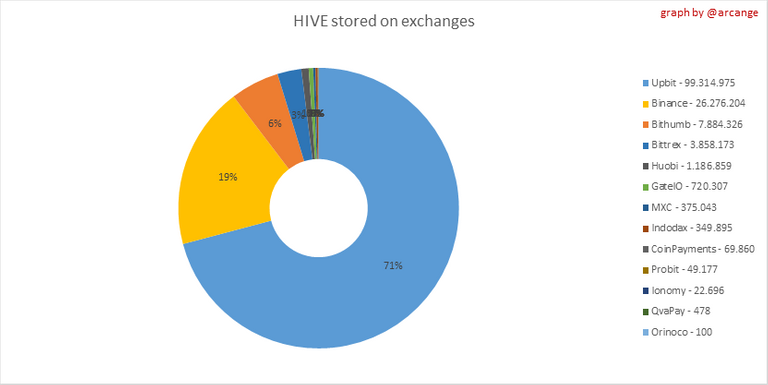 | 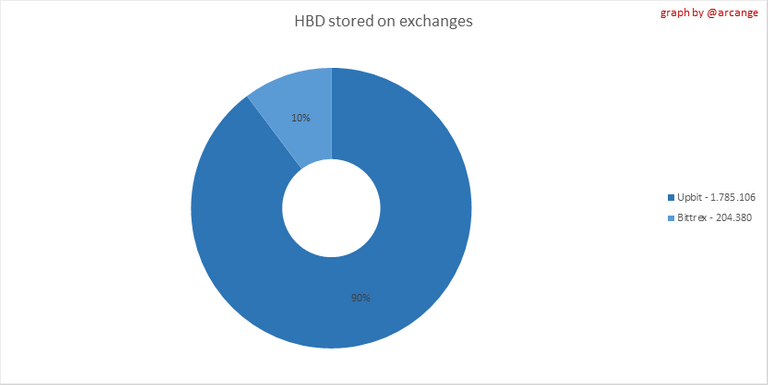 |
These graphs show the amount and distribution of HIVE and HBD stored on the exchanges where they are listed.
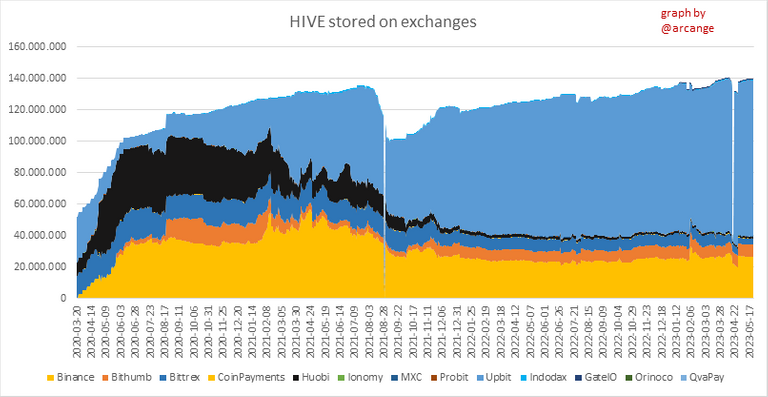 | 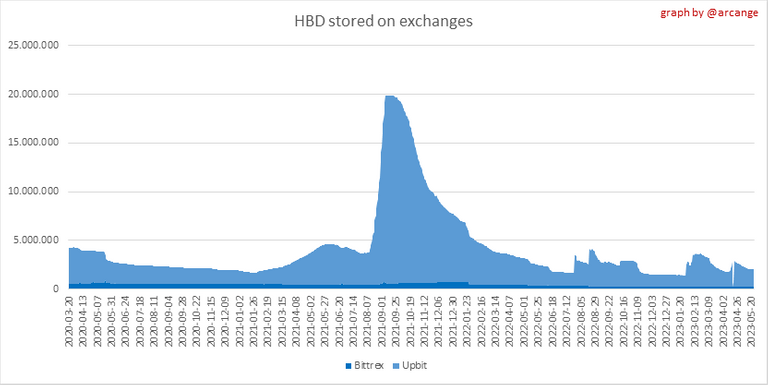 |
These graphs show the daily evolution of HIVE and HBD stored on the exchanges where they are listed.
I hope you find those stats useful. If you would like to see additional stats, feel free to drop me a comment. Your feedback is than welcome.
Thanks for reading.
Check out my apps and services


View or trade
BEER.Hey @arcange, here is a little bit of
BEERfrom @pixresteemer for you. Enjoy it!We love your support by voting @detlev.witness on HIVE .
Have you considered including Hive Engine in the exchange data? They are an exchange after all.
This is something that I may consider to do. Need to find some free time tho 😅
Oh yes!
The stats are very much useful
Keep it going!
Oh wow I made it into the top for depositing HBD to savings :D
The power up and power down ratio looks quite bad.
Congrats on making the list @tsnaks 🎉