Hive Financial Statistics – 2022.11.05

Welcome to the daily financial report about the Hive blockchain.
All the information presented in this report is based on the data collected from the blockchain until 2022-11-05 midnight UTC. This report aims to provide you with a clear view of what is happening on the Hive blockchain.
 Este post está traducido al español - aquí
 Dieser Beitrag ist ins Deutsche übersetzt - hier
 Une version en français de ce post est disponible - ici
1. Price
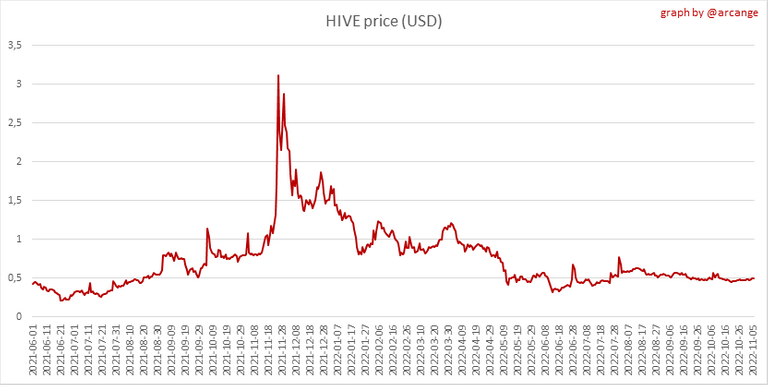 | 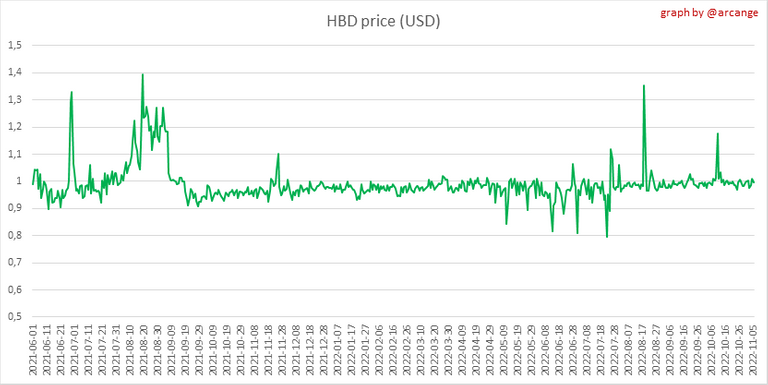 |
These graphs show the evolution of prices in USD for HIVE and HBD.
2. Supply
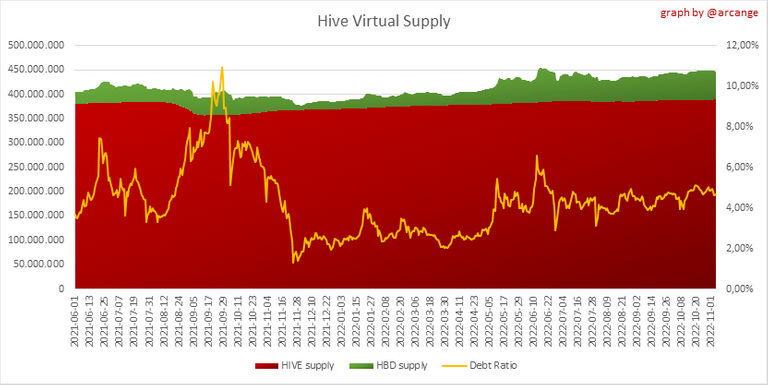
This graph shows the evolution of HIVE virtual Supply. The virtual supply is the sum of HIVE supply (liquid and staked HIVE) and HBD supply (converted into HIVE).
The graph also displays the debt ratio (HBD supply / HIVE virtual supply). Keep in mind that since hardfork 24 funds in the treasury (@hive.fund HBD balance) don't count towards the HBD debt ratio.
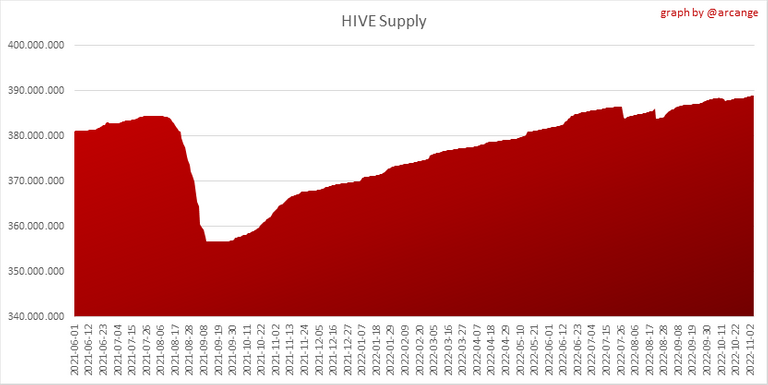 | 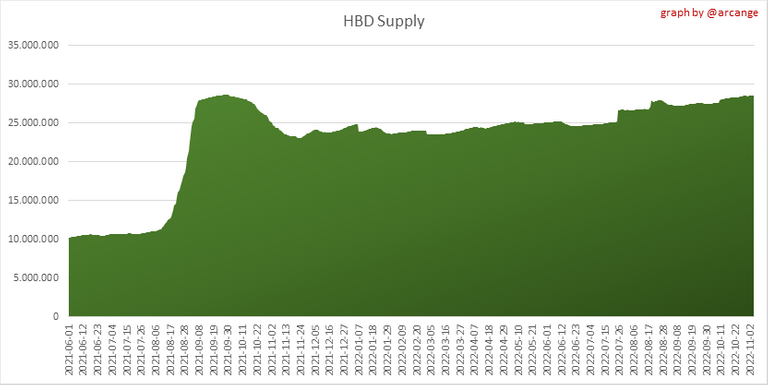 |
These graphs show the evolution of the HIVE Supply (both liquid and staked) and the HBD supply.
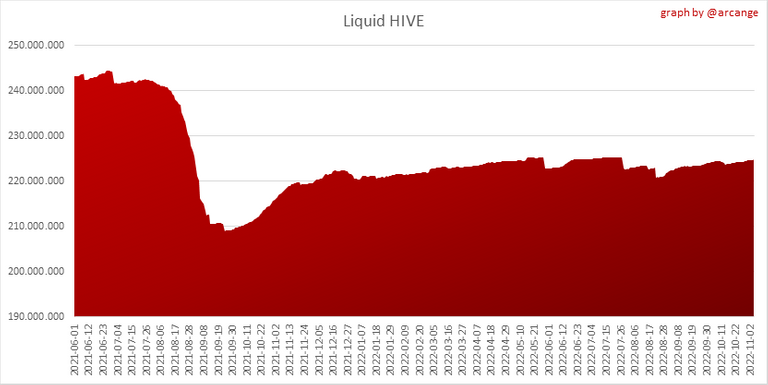 | 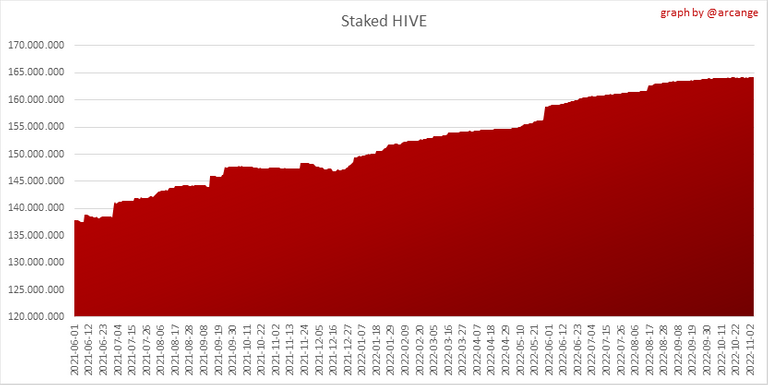 |
These charts show the evolution of the liquid HIVE and the staked HIVE (Hive Power).
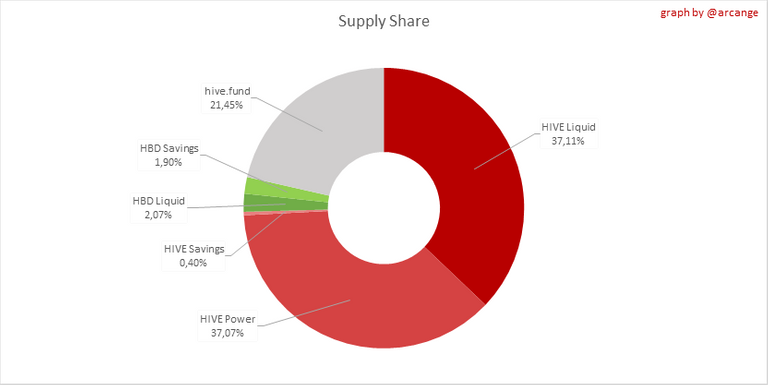
This graph shows the overall Hive tokens distribution.
3. HBD Savings
| Account | Deposit | Account | Withdrawal |
|---|---|---|---|
| @newsflash | 4,980.046 HBD | @demotruk | 1,000.000 HBD |
| @lunaticpandora | 4,932.684 HBD | @crypt-skip | 310.804 HBD |
| @bnb-hbd | 3,500.000 HBD | @triverse | 307.901 HBD |
| @mango-juice | 1,660.554 HBD | @steemychicken1 | 290.000 HBD |
| @mini-v | 1,241.000 HBD | @dadspardan | 288.873 HBD |
| @mangowambo | 871.056 HBD | @theduoxplorer | 121.650 HBD |
| @taskmaster4450le | 617.674 HBD | @henrietta27 | 82.000 HBD |
| @keychain | 390.000 HBD | @matthewbox | 79.400 HBD |
| @howweroll | 386.406 HBD | @stephcox | 50.493 HBD |
| @yoghurt | 251.800 HBD | @eliasvm.eth | 41.000 HBD |
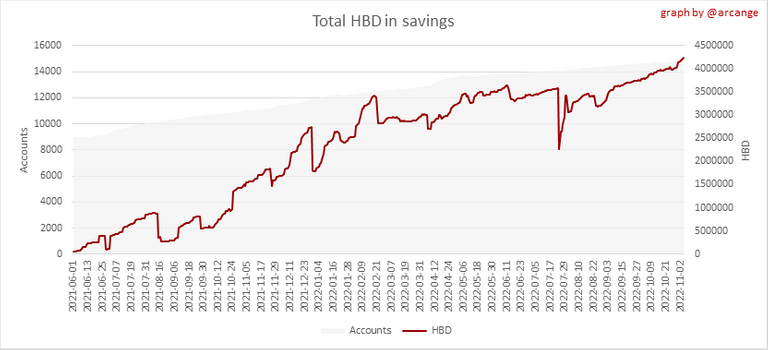
This graph shows how much and how many accounts store HBD in savings. The table below shows the topmost HBD deposits and withdrawals of the day.
Note: As of 2021-06-30 (HF25) interest is only paid for HBD which are stored in savings.
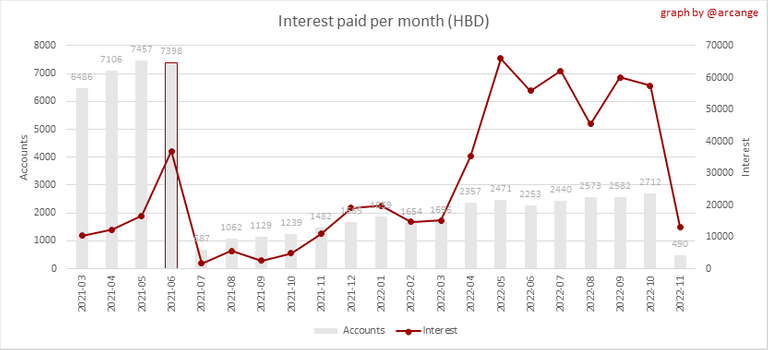
This chart shows the amount of interest paid each month for holding HBD and how many accounts received such interest.
4. Balances

This graph shows the number of HIVE, both liquid and in savings, held by all accounts.

This graph shows the number of HBD, both liquid and in savings, held by all accounts.
5. Conversions
Note: As a reminder, conversion requests are only finalized after 3 days. It is only then that it is known exactly how many HIVE were burned in return for the HBD received at the time of the conversion request.
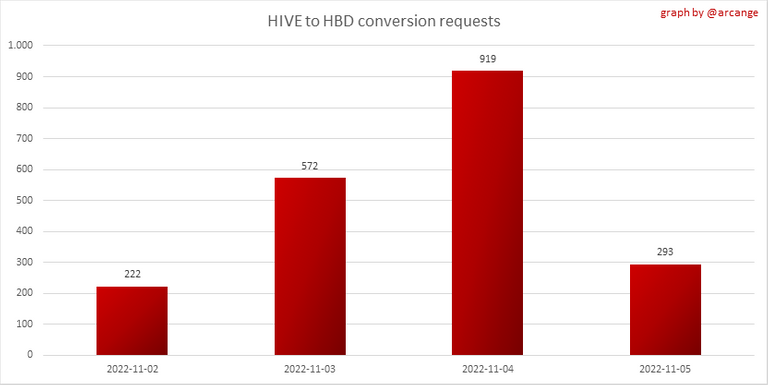
This graph shows the number of HIVE collateralized due to requests to convert HIVE to HBD over the past few days.
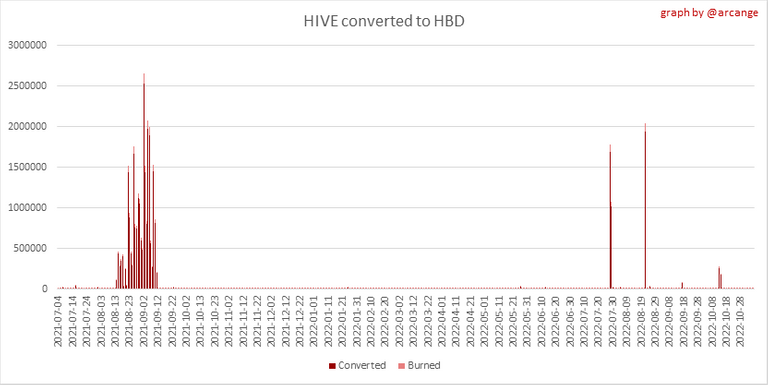 |  |
These graphs show the number of HIVE effectively used by the conversion process (HIVE converted and 5% HIVE fee which is burned) each day and month when requests to convert HIVE to HBD have been finalized.
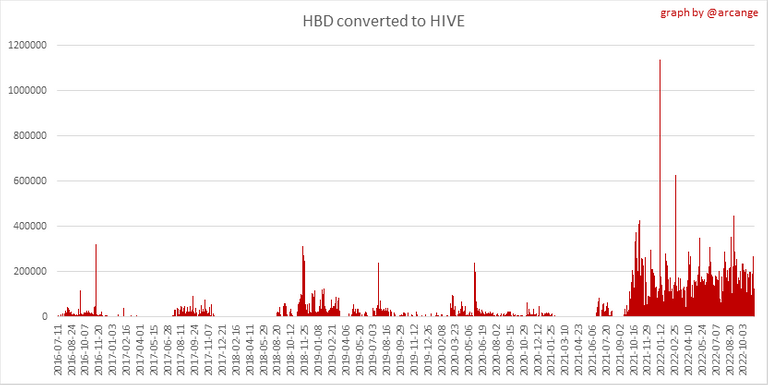 | 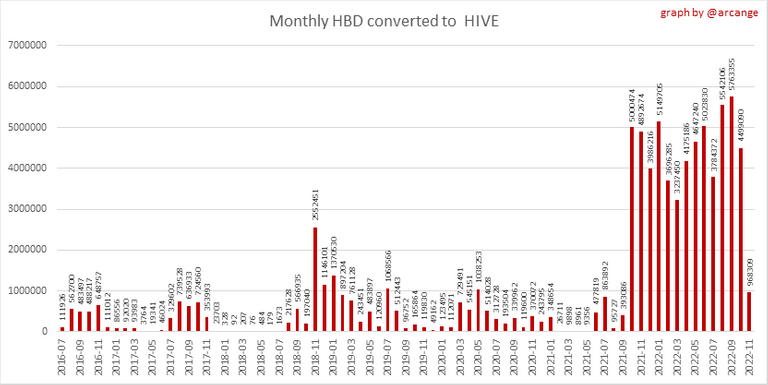 |
These graphs show the number of HBD burned, each day and each month, following requests to convert HBD to HIVE.
6. Powerup and Powerdown
| Date | Account | Amount |
|---|---|---|
| 2022-11-05 05:13:03 | @buildawhale | 156,270.196 HIVE |
| 2022-11-05 05:10:30 | @claudio83 | 32,360.521 HIVE |
| 2022-11-05 08:21:03 | @cervisia | 6,092.491 HIVE |
| 2022-11-05 09:26:06 | @betterthanhome | 5,426.419 HIVE |
| 2022-11-05 07:51:48 | @macaw | 5,043.320 HIVE |
| 2022-11-05 08:06:48 | @macaw | 5,043.320 HIVE |
| 2022-11-05 08:06:51 | @nickelbunker | 2,613.555 HIVE |
| 2022-11-05 07:51:48 | @nickelbunker | 2,613.555 HIVE |
| 2022-11-05 07:19:42 | @iamsaray | 2,024.008 HIVE |
| 2022-11-05 12:41:42 | @antoniojoseha | 1,154.808 HIVE |
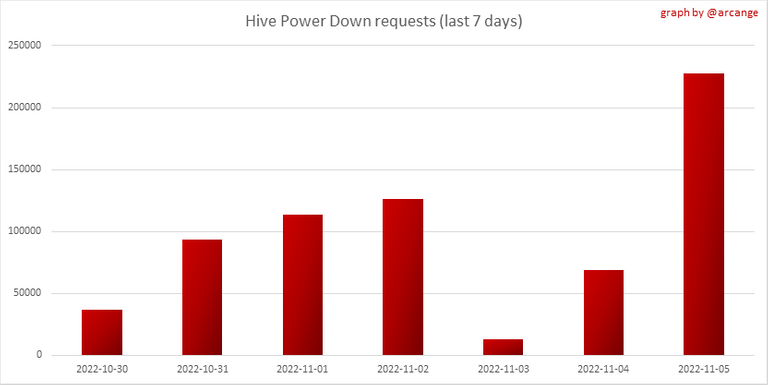
This graph and table show the amount of powerdown initiated over the last 7 days, and the largest initiated on this day.
| Account | Powerup | Account | Powerdown |
|---|---|---|---|
| @michaeladamparis | 1,020.000 HIVE | @newsflash | 151,869.980 HIVE |
| @luvinlyf | 985.000 HIVE | @peakd | 10,487.538 HIVE |
| @stea90 | 978.000 HIVE | @steemik | 6,970.525 HIVE |
| @dswigle | 769.000 HIVE | @omonomo | 5,706.348 HIVE |
| @marajah | 469.171 HIVE | @roelandp | 3,008.212 HIVE |
| @leook | 420.883 HIVE | @jim888 | 2,019.576 HIVE |
| @slobberchops | 329.429 HIVE | @phoenixonhive | 1,304.019 HIVE |
| @fredrikaa | 320.442 HIVE | @michealb | 897.056 HIVE |
| @ecoinstats | 275.000 HIVE | @jphamer1 | 731.407 HIVE |
| @professorx | 240.003 HIVE | @adambarratt | 537.363 HIVE |
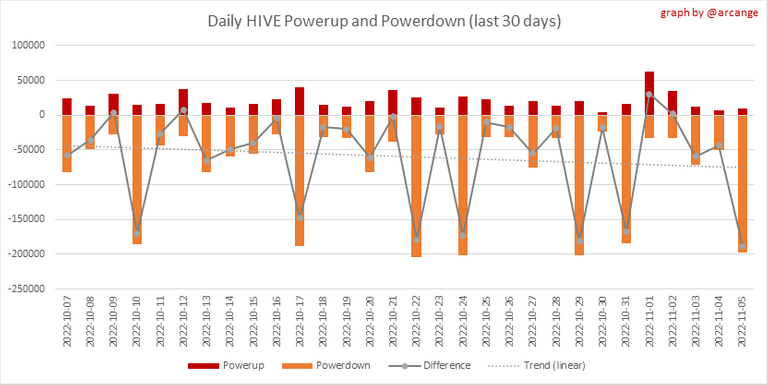
This graph shows the daily HIVE power-up, power-down, and the resulting variation over the last 30 days. The table shows the topmost power-ups and power-downs of the day.
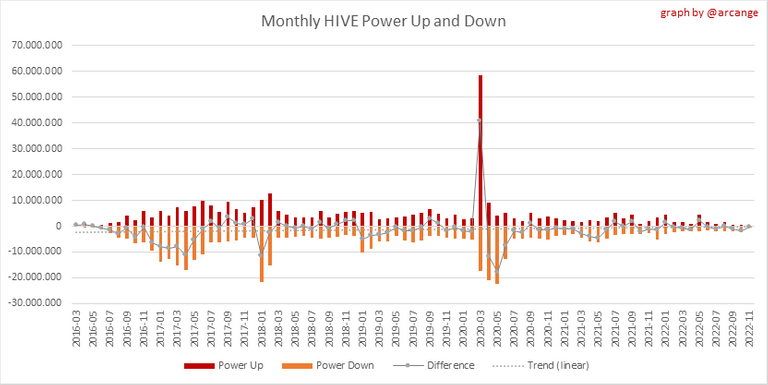
This graph shows the monthly HIVE power-up, power-down and the resulting variation.
Values for the last 3 months
| Period | Powerup | Powerdown | Difference |
|---|---|---|---|
| 2022-11 | 126,352.000 | 384,479.000 | -258,127.000 |
| 2022-10 | 606,941.000 | 2,422,080.000 | -1,815,139.000 |
| 2022-09 | 677,489.000 | 1,911,436.000 | -1,233,947.000 |
7. Transfers
These graphs show the volume (in USD) of HIVE and HBD transferred between accounts.
8. Exchanges
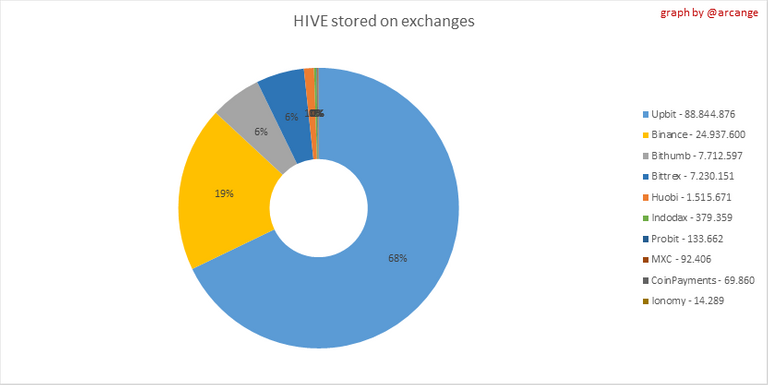 | 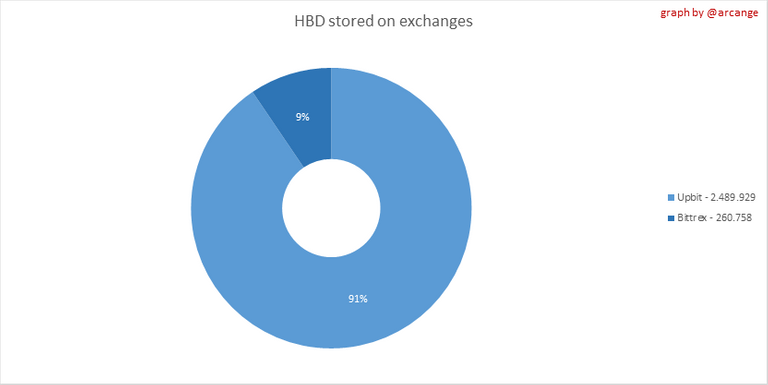 |
These graphs show the amount and distribution of HIVE and HBD stored on the exchanges where they are listed.
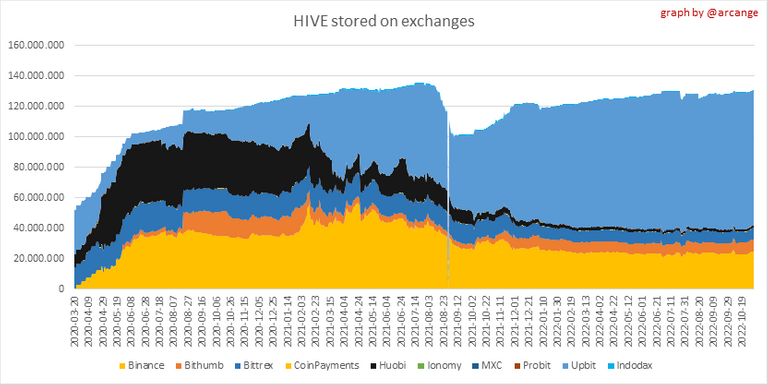 |  |
These graphs show the daily evolution of HIVE and HBD stored on the exchanges where they are listed.
I hope you find those stats useful. If you would like to see additional stats, feel free to drop me a comment. Your feedback is than welcome.
Thanks for reading.
Check out my apps and services


Thanks! It is always interesting to see the big picture!
Congratulations @arcange! You received a personal badge!
You can view your badges on your board and compare yourself to others in the Ranking
Check out the last post from @hivebuzz:
Am glad to fall among those that powered up this week though newbie in this platform. Am promising to do more in the future.
Congrats on making the list @marajah 🎉😉
@arcange, thank you. Wishing to do more