Hive Financial Statistics – 2022.08.13

Welcome to the daily financial report about the Hive blockchain.
All the information presented in this report is based on the data collected from the blockchain until 2022-08-13 midnight UTC. This report aims to provide you with a clear view of what is happening on the Hive blockchain.
 Este post está traducido al español - aquí
 Dieser Beitrag ist ins Deutsche übersetzt - hier
 Une version en français de ce post est disponible - ici
1. Price
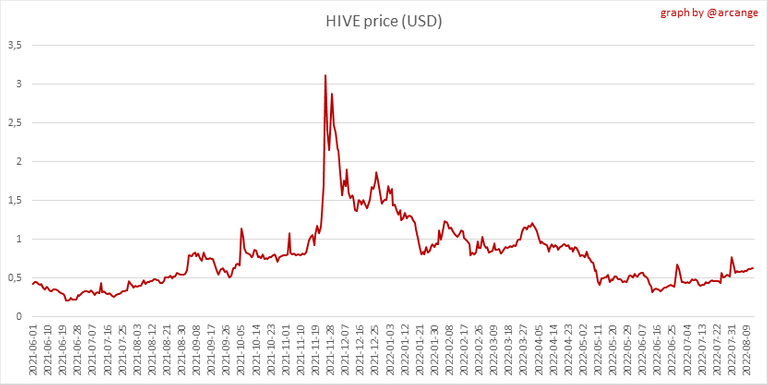 | 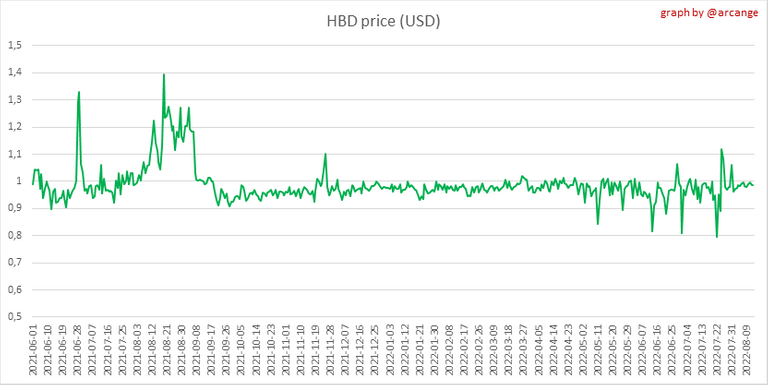 |
These graphs show the evolution of prices in USD for HIVE and HBD.
2. Supply
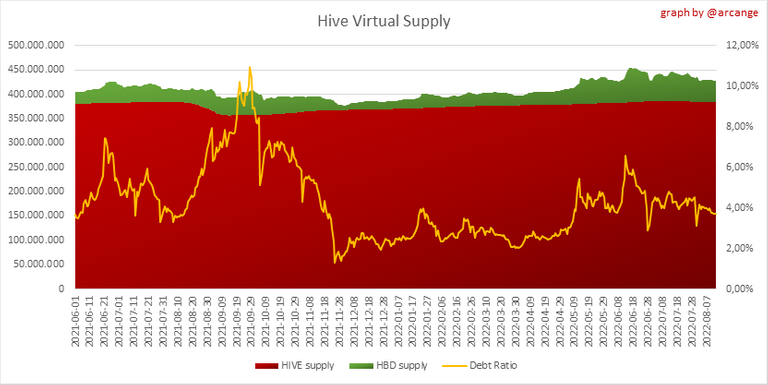
This graph shows the evolution of HIVE virtual Supply. The virtual supply is the sum of HIVE supply (liquid and staked HIVE) and HBD supply (converted into HIVE).
The graph also displays the debt ratio (HBD supply / HIVE virtual supply). Keep in mind that since hardfork 24 funds in the treasury (@hive.fund HBD balance) don't count towards the HBD debt ratio.
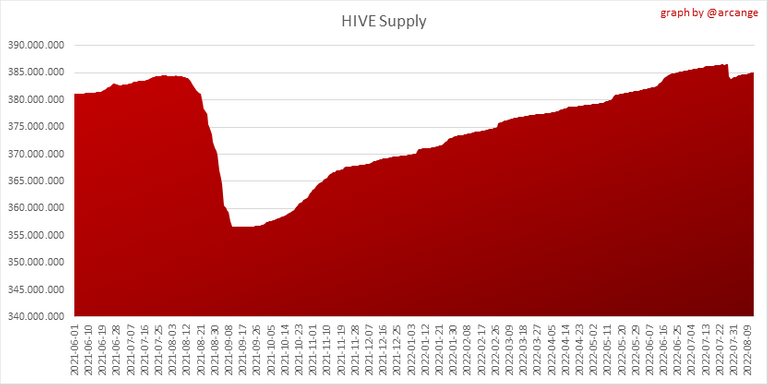 | 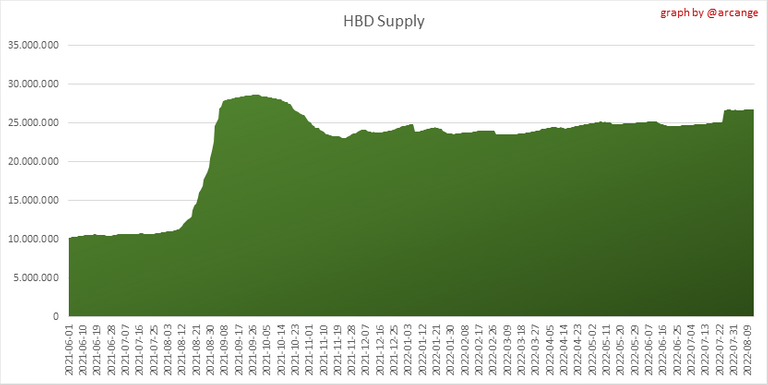 |
These graphs show the evolution of the HIVE Supply (both liquid and staked) and the HBD supply.
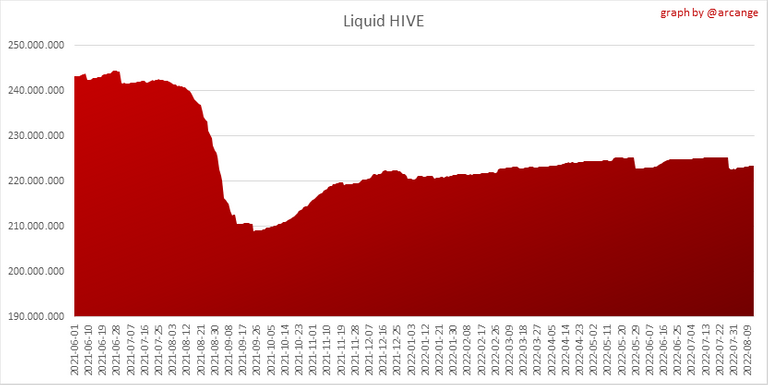 | 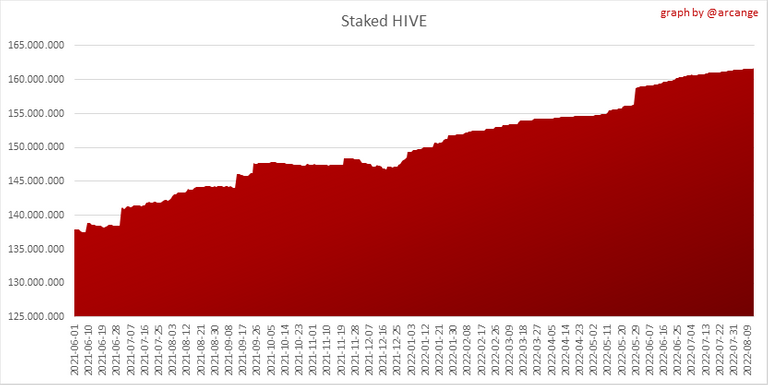 |
These charts show the evolution of the liquid HIVE and the staked HIVE (Hive Power).
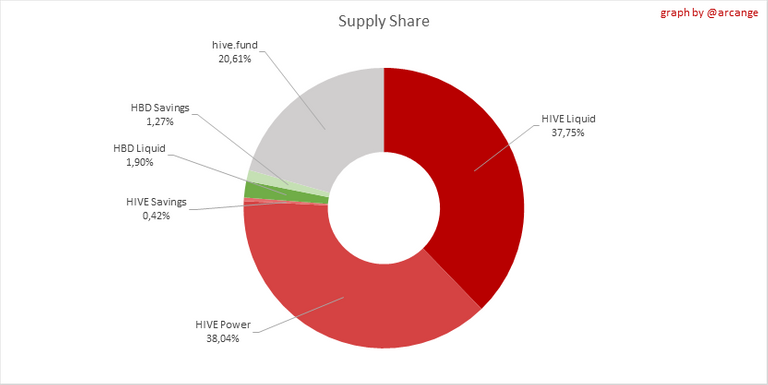
This graph shows the overall Hive tokens distribution.
3. HBD Savings
| Account | Deposit | Account | Withdrawal |
|---|---|---|---|
| @dfund | 9,999.997 HBD | @muenchen | 3,155.541 HBD |
| @catinthewindow | 1,615.000 HBD | @luislrt | 126.000 HBD |
| @risingstarhub | 1,000.000 HBD | @hetty-rowan | 105.078 HBD |
| @thelittlebank | 570.992 HBD | @tobetada | 56.803 HBD |
| @keychain | 390.000 HBD | @xg4028 | 50.000 HBD |
| @hiveauth | 324.984 HBD | @kellyane | 26.734 HBD |
| @sanjeev021 | 324.073 HBD | @leeendah | 12.000 HBD |
| @hivechain.app | 189.984 HBD | @joanmanuelg | 10.977 HBD |
| @andablackwidow | 131.000 HBD | @bteim | 10.000 HBD |
| @qwerrie | 106.724 HBD | @anthony2019 | 10.000 HBD |
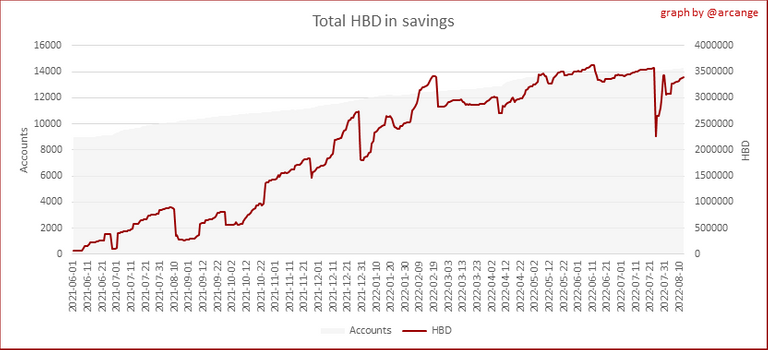
This graph shows how much and how many accounts store HBD in savings. The table below shows the topmost HBD deposits and withdrawals of the day.
Note: As of 2021-06-30 (HF25) interest is only paid for HBD which are stored in savings.
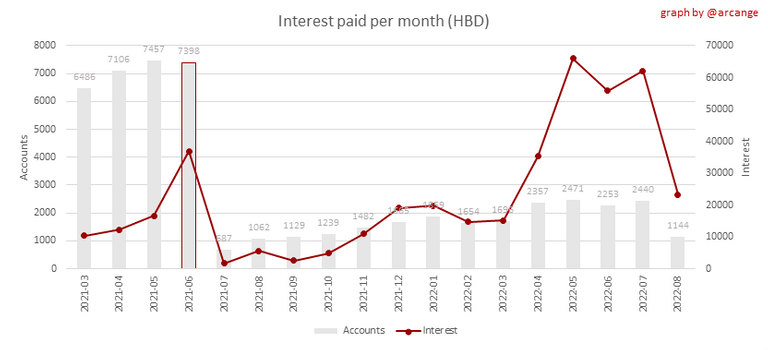
This chart shows the amount of interest paid each month for holding HBD and how many accounts received such interest.
4. Balances
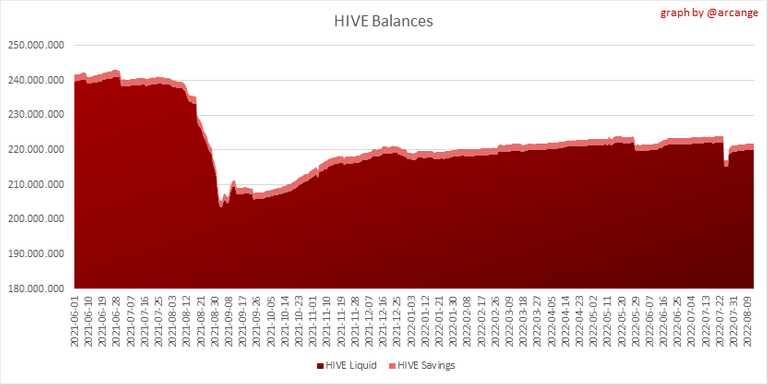
This graph shows the number of HIVE, both liquid and in savings, held by all accounts.
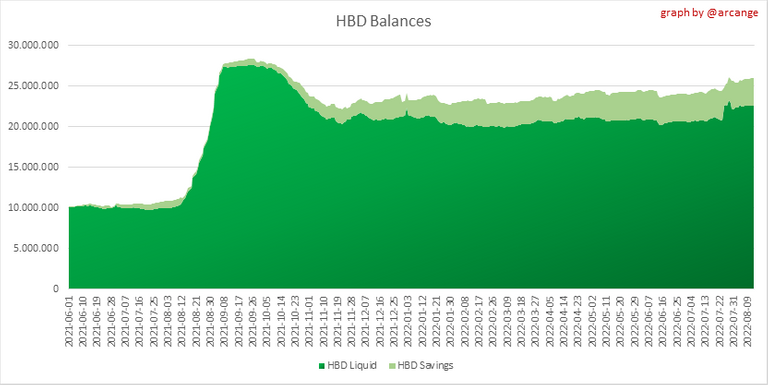
This graph shows the number of HBD, both liquid and in savings, held by all accounts.
5. Conversions
Note: As a reminder, conversion requests are only finalized after 3 days. It is only then that it is known exactly how many HIVE were burned in return for the HBD received at the time of the conversion request.
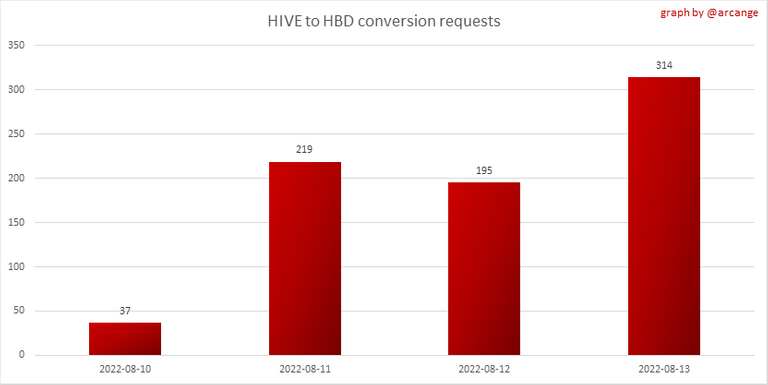
This graph shows the number of HIVE collateralized due to requests to convert HIVE to HBD over the past few days.
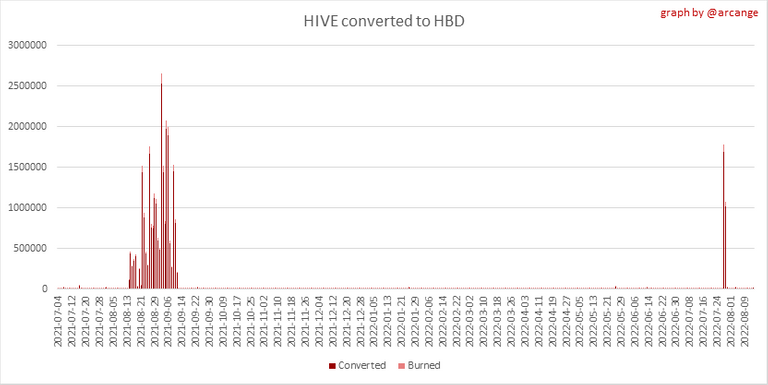 | 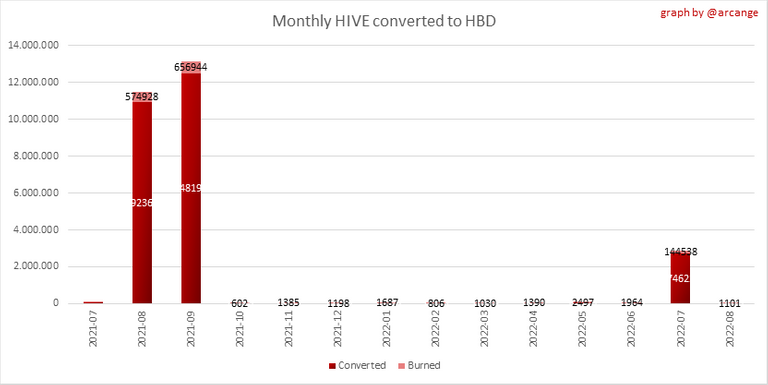 |
These graphs show the number of HIVE effectively used by the conversion process (HIVE converted and 5% HIVE fee which is burned) each day and month when requests to convert HIVE to HBD have been finalized.
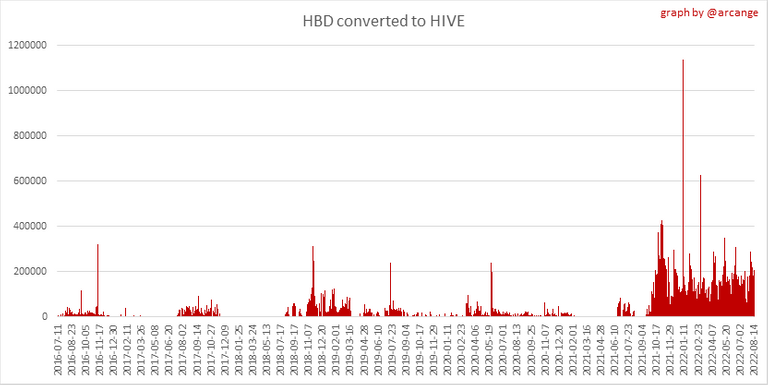 | 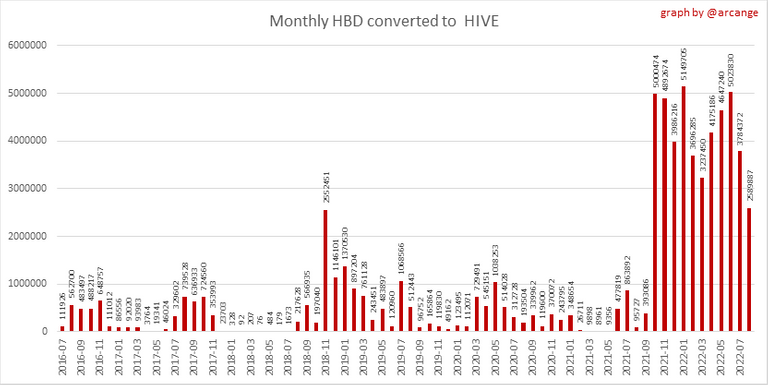 |
These graphs show the number of HBD burned, each day and each month, following requests to convert HBD to HIVE.
6. Powerup and Powerdown
| Date | Account | Amount |
|---|---|---|
| 2022-08-13 06:34:48 | @omonomo | 73,732.258 HIVE |
| 2022-08-13 06:35:15 | @omonomo | 73,706.325 HIVE |
| 2022-08-13 01:02:21 | @gregory-f | 52,005.357 HIVE |
| 2022-08-13 06:19:36 | @phoenixonhive | 16,843.451 HIVE |
| 2022-08-13 11:10:09 | @geneeverett | 6,718.475 HIVE |
| 2022-08-13 09:04:39 | @inspiringquotes | 5,688.439 HIVE |
| 2022-08-13 03:55:30 | @web-gnar | 3,366.186 HIVE |
| 2022-08-13 07:34:45 | @thisismylife | 2,953.964 HIVE |
| 2022-08-13 09:57:27 | @kommienezuspadt | 2,723.794 HIVE |
| 2022-08-13 09:25:24 | @carminasalazarte | 1,900.071 HIVE |
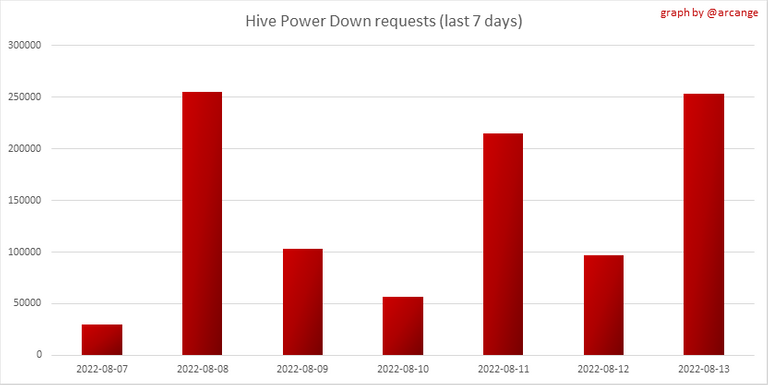
This graph and table show the amount of powerdown initiated over the last 7 days, and the largest initiated on this day.
| Account | Powerup | Account | Powerdown |
|---|---|---|---|
| @neal.power | 1,295.060 HIVE | @abh12345 | 7,161.620 HIVE |
| @frosties | 1,187.303 HIVE | @fulltimegeek | 2,042.595 HIVE |
| @anewclassic | 875.513 HIVE | @extrospect | 1,720.626 HIVE |
| @antonine | 775.237 HIVE | @aicu | 1,542.719 HIVE |
| @dcrops | 629.636 HIVE | @bitshares101 | 1,449.278 HIVE |
| @nftinvest | 600.541 HIVE | @adalger | 1,410.526 HIVE |
| @jkeen33 | 560.748 HIVE | @june0620 | 1,388.045 HIVE |
| @dibblers.dabs | 500.000 HIVE | @tobetada | 1,149.369 HIVE |
| @genepoolcardlord | 497.595 HIVE | @jphamer1 | 726.649 HIVE |
| @newageinv | 310.308 HIVE | @elgeko | 655.286 HIVE |
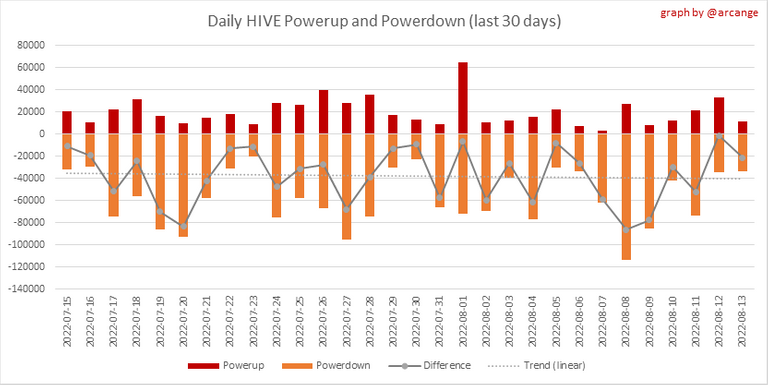
This graph shows the daily HIVE power-up, power-down, and the resulting variation over the last 30 days. The table shows the topmost power-ups and power-downs of the day.
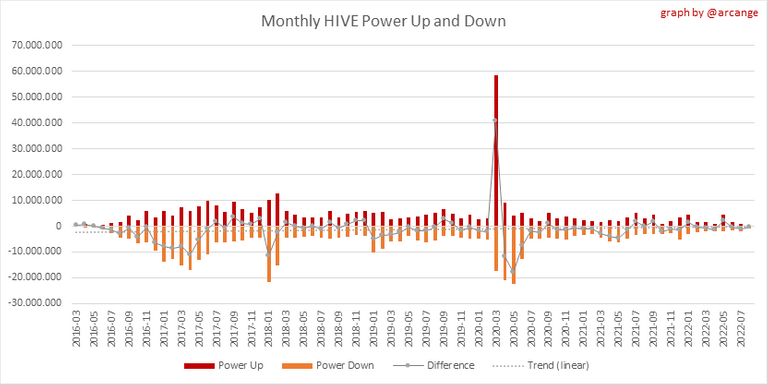
This graph shows the monthly HIVE power-up, power-down and the resulting variation.
Values for the last 3 months
| Period | Powerup | Powerdown | Difference |
|---|---|---|---|
| 2022-08 | 251,280.000 | 766,203.000 | -514,923.000 |
| 2022-07 | 802,177.000 | 1,891,268.000 | -1,089,091.000 |
| 2022-06 | 1,444,478.000 | 1,698,001.000 | -253,523.000 |
7. Transfers
These graphs show the volume (in USD) of HIVE and HBD transferred between accounts.
8. Exchanges
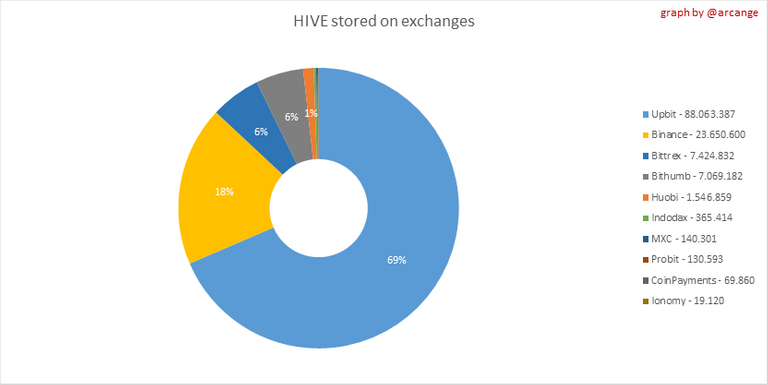 | 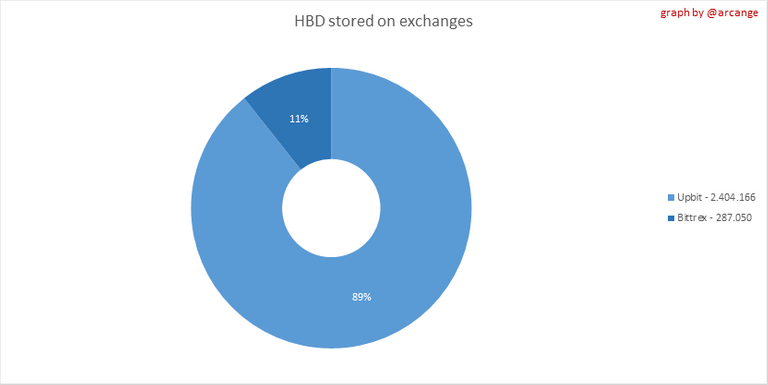 |
These graphs show the amount and distribution of HIVE and HBD stored on the exchanges where they are listed.
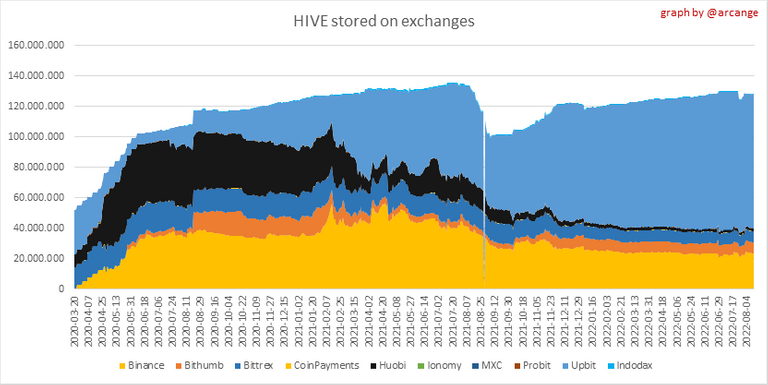 | 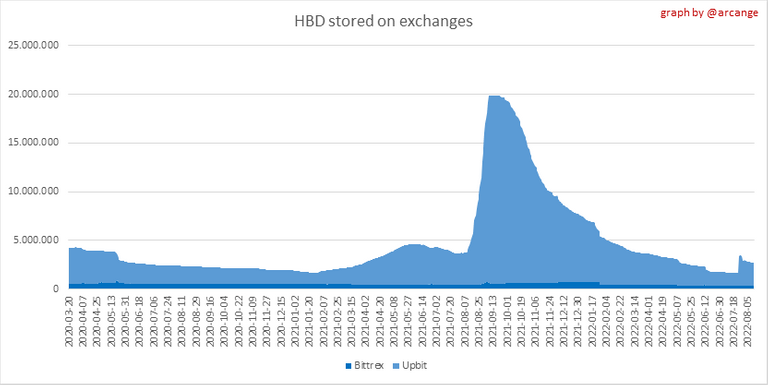 |
These graphs show the daily evolution of HIVE and HBD stored on the exchanges where they are listed.
I hope you find those stats useful. If you would like to see additional stats, feel free to drop me a comment. Your feedback is than welcome.
Thanks for reading.
Check out my apps and services


View or trade
BEER.Hey @arcange, here is a little bit of
BEERfrom @pixresteemer for you. Enjoy it!Learn how to earn FREE BEER each day by staking your
BEER.It's interesting to see the HBD saving not really moving. I wonder what'll happen if the HIVE price starts to move upwards.
With HIVE price moving up for several days, it will become more tempting to convert HBD to HIVE and sell them.
That would be like shooting your own foot, the HBD price would be relatively low. I'd assume if the #HIVE price dips, people will try to get HBD out and buy HIVE with it and vice versa.
Thinking about it, we need more HBD in circulation internal and external. That could create a smoothly swinging chart view.