Hive Financial Statistics – 2022.04.22

Welcome to the daily financial report about the Hive blockchain.
All the information presented in this report is based on the data collected from the blockchain until 2022-04-22 midnight UTC. This report aims to provide you with a clear view of what is happening on the Hive blockchain.
 Este post está traducido al español - aquí
 Dieser Beitrag ist ins Deutsche übersetzt - hier
 Une version en français de ce post est disponible - ici
1. Price
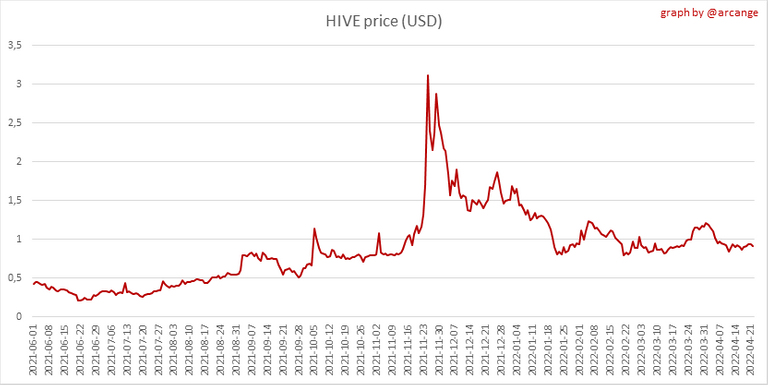 | 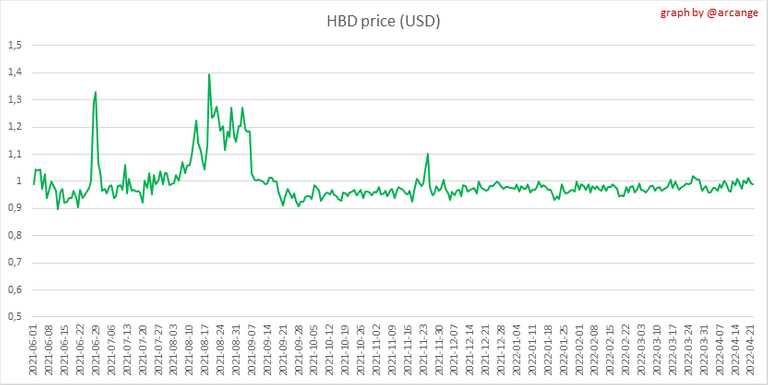 |
These graphs show the evolution of prices in USD for HIVE and HBD.
2. Supply
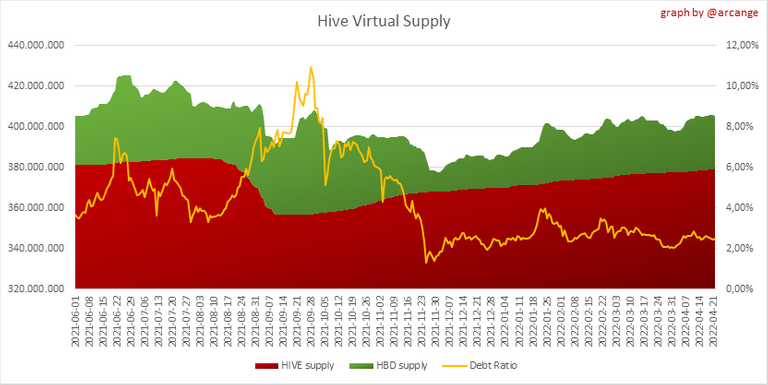
This graph shows the evolution of HIVE virtual Supply. The virtual supply is the sum of HIVE supply (liquid and staked HIVE) and HBD supply (converted into HIVE).
The graph also displays the debt ratio (HBD supply / HIVE virtual supply). Keep in mind that since hardfork 24 funds in the treasury (@hive.fund HBD balance) don't count towards the HBD debt ratio.
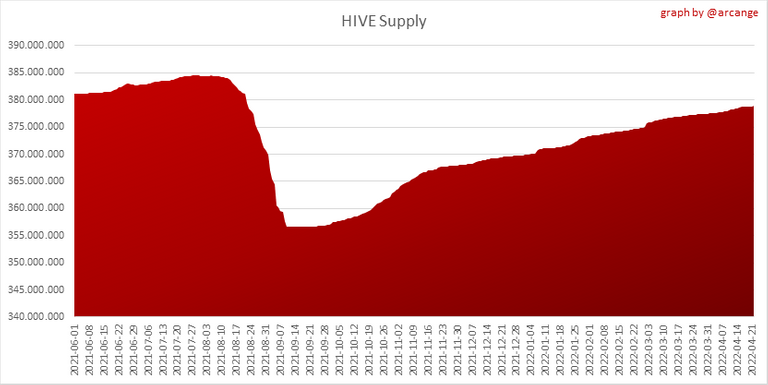 | 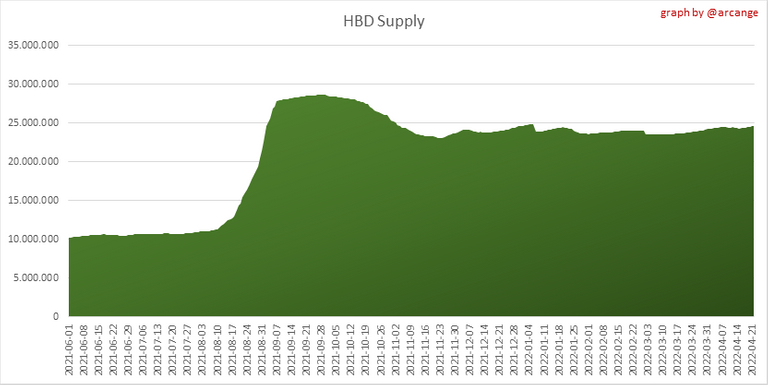 |
These graphs show the evolution of the HIVE Supply (both liquid and staked) and the HBD supply.
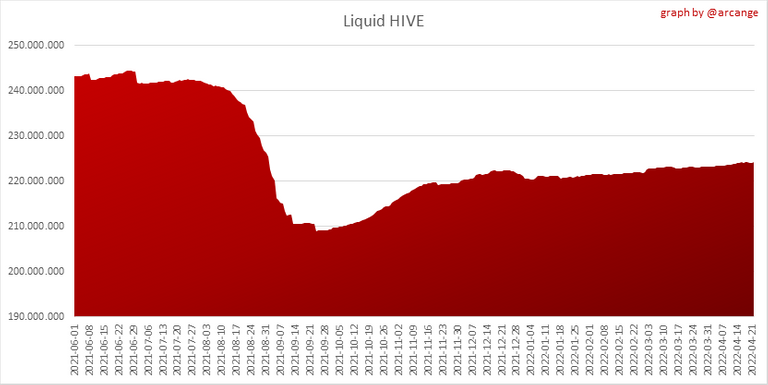 | 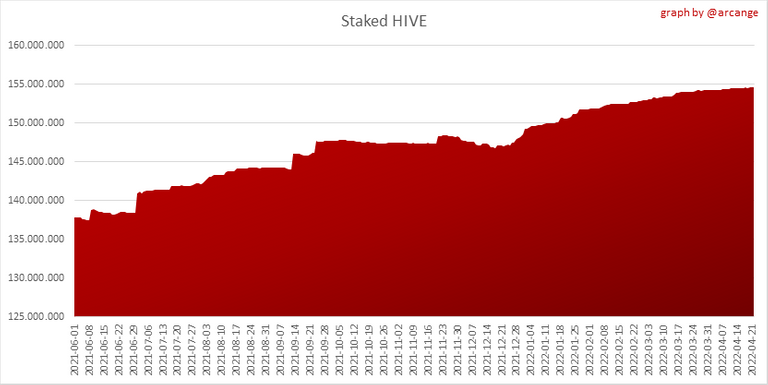 |
These charts show the evolution of the liquid HIVE and the staked HIVE (Hive Power).
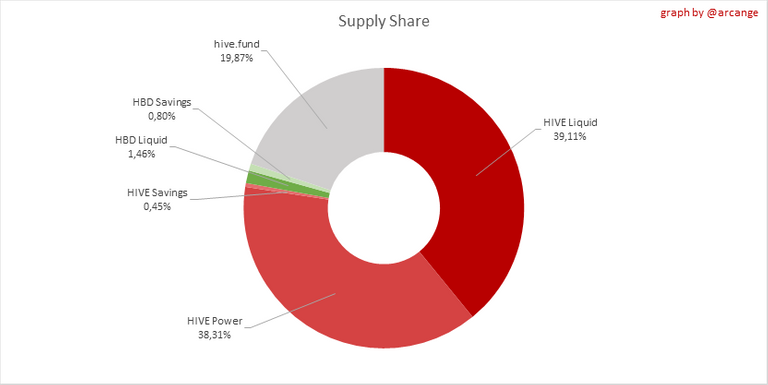
This graph shows the overall Hive tokens distribution.
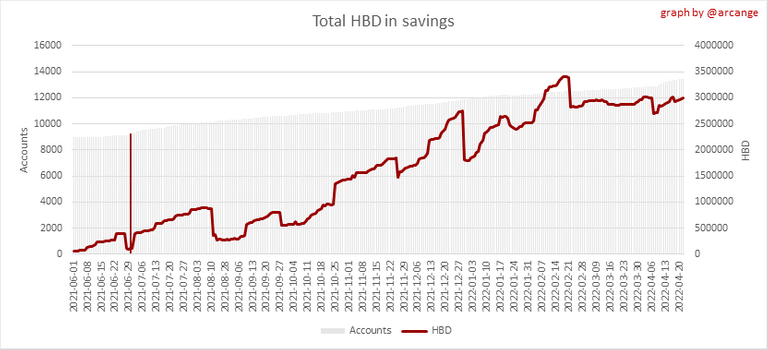
3. HBD Savings
| Account | Deposit | Account | Withdrawal |
|---|---|---|---|
| @keychain | 5,389.000 HBD | @mika | 100,000.000 HBD |
| @scottcbusiness | 2,472.345 HBD | @jauregui98 | 500.130 HBD |
| @v4vapp.dhf | 1,000.000 HBD | @senorcoconut | 429.877 HBD |
| @chewsk1 | 910.000 HBD | @revisesociology | 200.000 HBD |
| @belemo | 716.847 HBD | @fionasfavourites | 197.361 HBD |
| @schlees | 703.968 HBD | @shawnlauzon | 118.009 HBD |
| @gohive | 500.003 HBD | @borislavzlatanov | 100.000 HBD |
| @kiriel98 | 400.000 HBD | @gr33nm4ster | 64.000 HBD |
| @hiveauth | 324.984 HBD | @laloretoyya | 59.809 HBD |
| @taskmaster4450le | 263.492 HBD | @javwee32 | 54.000 HBD |
This graph shows how much and how many accounts store HBD in savings. The table below shows the topmost HBD deposits and withdrawals of the day.
Note: As of 2021-06-30 (HF25) interest is only paid for HBD which are stored in savings.
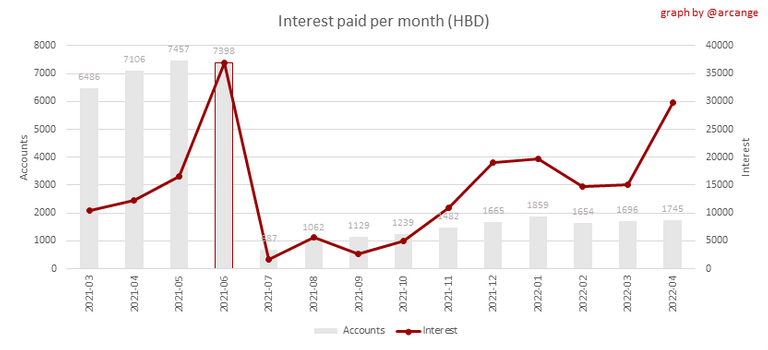
This chart shows the amount of interest paid each month for holding HBD and how many accounts received such interest.
4. Balances
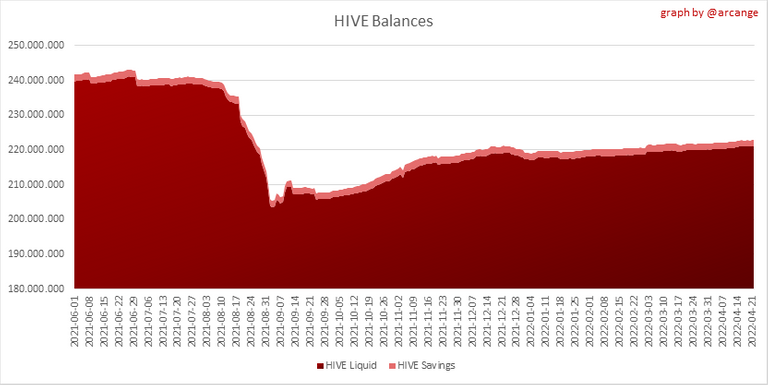
This graph shows the number of HIVE, both liquid and in savings, held by all accounts.
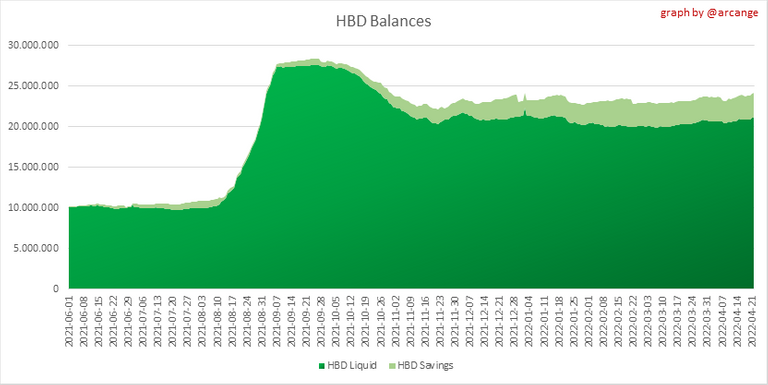
This graph shows the number of HBD, both liquid and in savings, held by all accounts.
5. Conversions
Note: As a reminder, conversion requests are only finalized after 3 days. It is only then that it is known exactly how many HIVE were burned in return for the HBD received at the time of the conversion request.
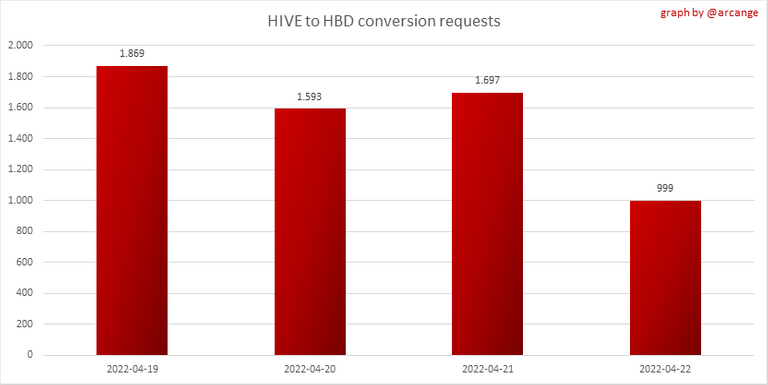
This graph shows the number of HIVE collateralized due to requests to convert HIVE to HBD over the past few days.
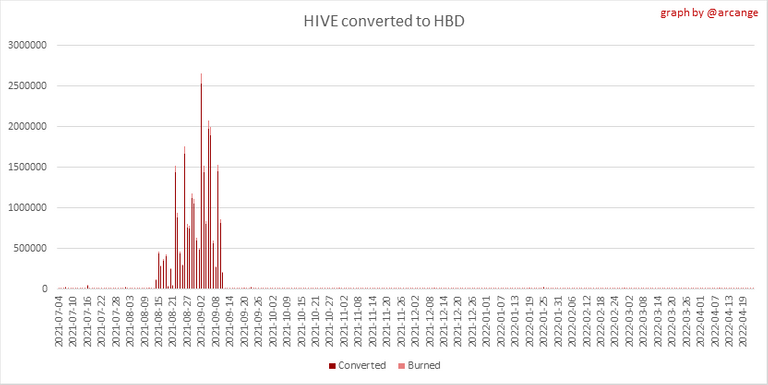 |  |
These graphs show the number of HIVE effectively used by the conversion process (HIVE converted and 5% HIVE fee which is burned) each day and month when requests to convert HIVE to HBD have been finalized.
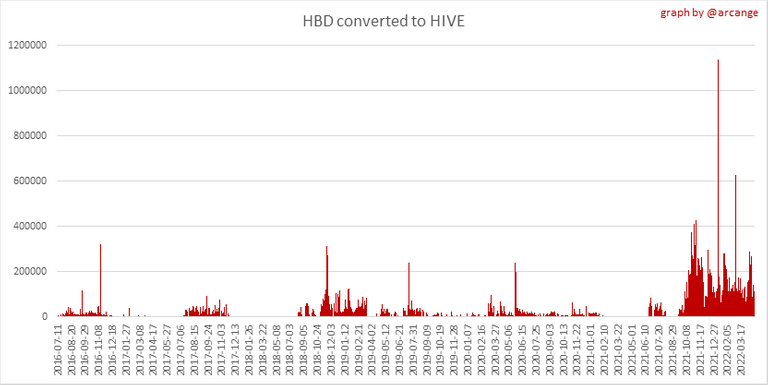 | 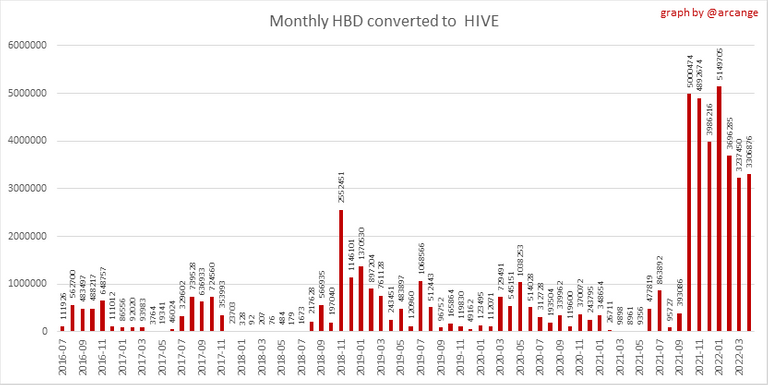 |
These graphs show the number of HBD burned, each day and each month, following requests to convert HBD to HIVE.
6. Powerup and Powerdown
| Date | Account | Amount |
|---|---|---|
| 2022-04-22 03:21:36 | @solominer | 10,400.596 HIVE |
| 2022-04-22 11:51:42 | @lauramica | 5,200.357 HIVE |
| 2022-04-22 06:33:09 | @anarchofacebook | 3,000.141 HIVE |
| 2022-04-22 03:08:45 | @emiliomoron | 2,600.151 HIVE |
| 2022-04-22 01:35:09 | @zullyscott | 2,121.219 HIVE |
| 2022-04-22 06:16:15 | @camuel | 2,000.096 HIVE |
| 2022-04-22 01:09:27 | @gabyjc | 1,696.684 HIVE |
| 2022-04-22 09:10:03 | @yusvelasquez | 1,625.063 HIVE |
| 2022-04-22 09:54:39 | @randomtravels | 1,400.137 HIVE |
| 2022-04-22 02:49:54 | @emiliomoron | 1,300.077 HIVE |
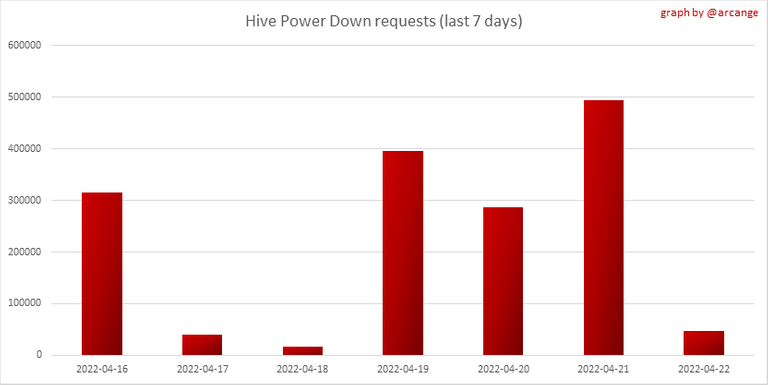
This graph and table show the amount of powerdown initiated over the last 7 days, and the largest initiated on this day.
| Account | Powerup | Account | Powerdown |
|---|---|---|---|
| @jphamer1 | 2,129.990 HIVE | @therealwolf | 7,904.478 HIVE |
| @ecoinstats | 1,344.000 HIVE | @jesta | 6,098.360 HIVE |
| @ssjsasha | 907.000 HIVE | @roelandp | 5,019.046 HIVE |
| @venarisyndicate | 424.791 HIVE | @evgen-xx | 2,710.463 HIVE |
| @badquakerdotcom | 400.021 HIVE | @urri2020 | 2,575.532 HIVE |
| @mintfinch | 400.001 HIVE | @reseller | 2,503.613 HIVE |
| @skenderbeu | 390.000 HIVE | @disconnect | 2,086.379 HIVE |
| @kubak | 300.000 HIVE | @thealliance | 1,928.289 HIVE |
| @doitvoluntarily | 269.300 HIVE | @tipu | 1,899.950 HIVE |
| @john-chen | 244.026 HIVE | @luckyolddaddy | 1,489.407 HIVE |
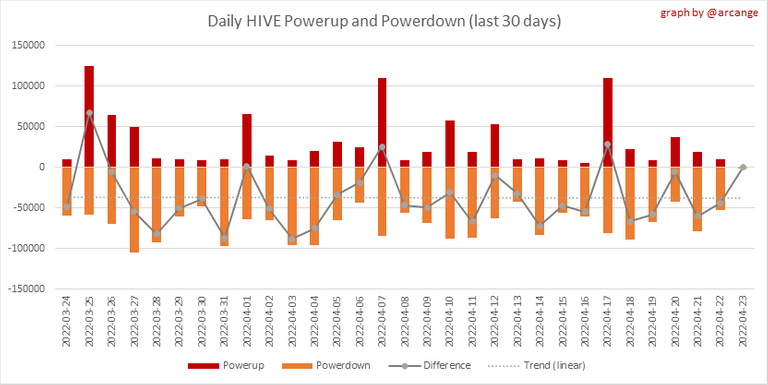
This graph shows the daily HIVE power-up, power-down, and the resulting variation over the last 30 days. The table shows the topmost power-ups and power-downs of the day.
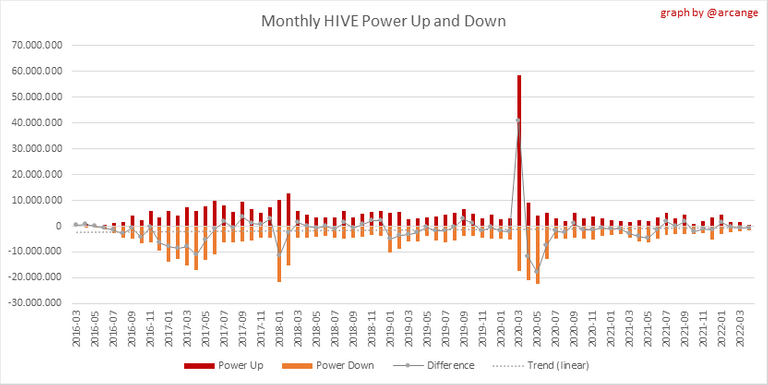
This graph shows the monthly HIVE power-up, power-down and the resulting variation.
Values for the last 3 months
| Period | Powerup | Powerdown | Difference |
|---|---|---|---|
| 2022-04 | 676,173.000 | 1,534,024.000 | -857,851.000 |
| 2022-03 | 1,495,982.000 | 2,097,310.000 | -601,328.000 |
| 2022-02 | 1,749,531.000 | 2,228,644.000 | -479,113.000 |
7. Transfers
These graphs show the volume (in USD) of HIVE and HBD transferred between accounts.
8. Exchanges
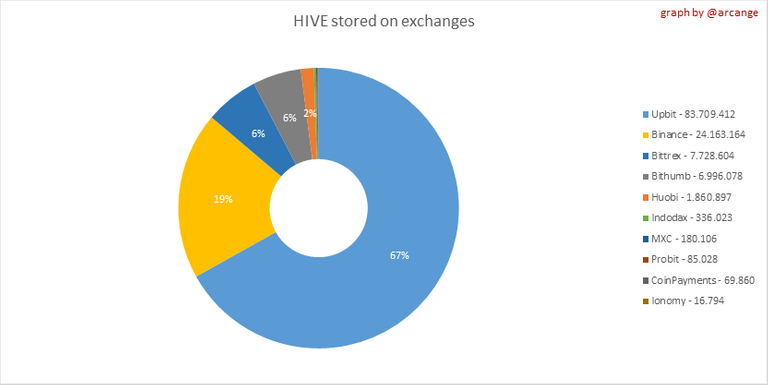 | 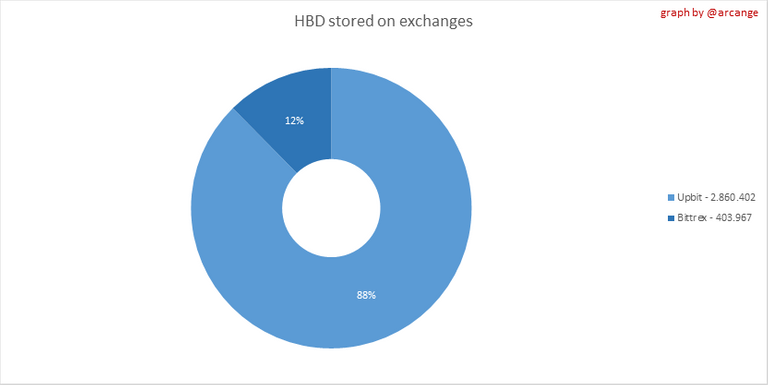 |
These graphs show the amount and distribution of HIVE and HBD stored on the exchanges where they are listed.
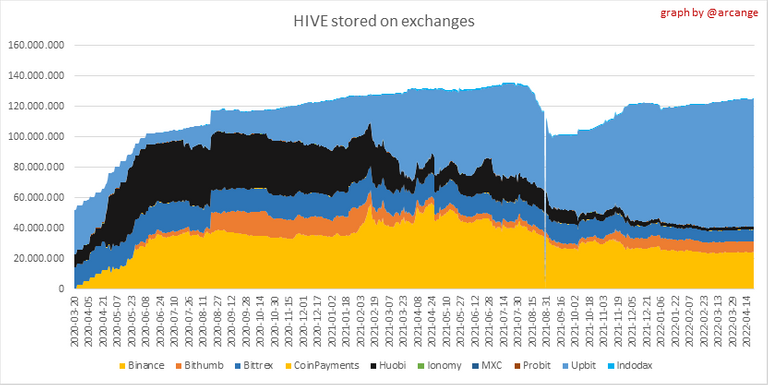 | 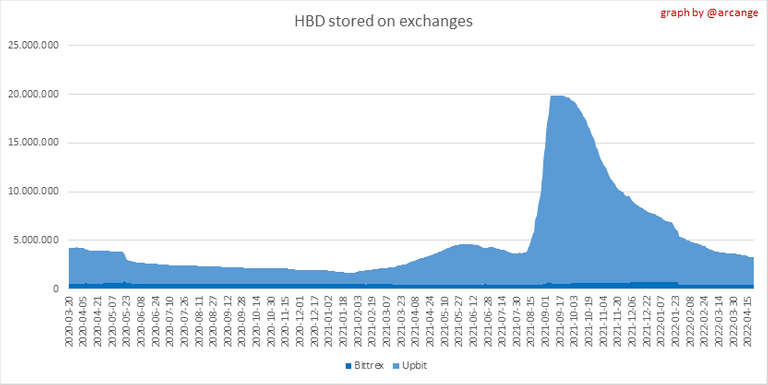 |
These graphs show the daily evolution of HIVE and HBD stored on the exchanges where they are listed.
I hope you find those stats useful. If you would like to see additional stats, feel free to drop me a comment. Your feedback is than welcome.
Thanks for reading.
Check out my apps and services


View or trade
BEER.Hey @arcange, here is a little bit of
BEERfrom @pixresteemer for you. Enjoy it!Learn how to earn FREE BEER each day by staking your
BEER.Great infographics as always and I wonder if you have any stats also on communities and their second layer tokens. What I am interested in and maybe others as well is to see how much a second layer token provides as APR% from curation.
Posted Using LeoFinance Beta
That would be great to see in deed!
Posted Using LeoFinance Beta
I love all the graphs and data, thanks for presenting this! It looks like HBD supply is being converted into hive as we sit below $1.00 usd on hive, showing support for hive. I think the way the chain is utilizing HBD to stabilize hive around $1.00 is genius.
Could have something to do with the pHBD/USDC pool too.
Posted Using LeoFinance Beta
im ignorant of that pool, how do you think it has a stabilizing effect on hive?
I'm not sure how that would effect the stabilization.
What made me think of that is when you said:
I'm thinking a lot of HBD is being converted to pHBD. That pool can be found here: https://polycub.com/farms
Posted Using LeoFinance Beta
When people convert HBD to hive when hive is below 1. they get extra hive per hbd, and this process burns hbd and creates new hive.
When hive rises above 1.05, people can convert hive into HBD for a 5% fee, this conversion burns hive and creates hbd.
so its two mechanisms that stablize the price in my opinion.
ok, thanks for that. I never really looked into how tat works!
Posted Using LeoFinance Beta
no problemo, ive been reading a lot of posts by the hive developers, i didnt figure it out on my own lolz
I'm surprised to see only a handful of people stored their HBD in savings... It sees very little. Is this because of the pHBD pool, have a lot of people wrapped their HBD, or is HBD just not something a lot of accounts heldp on to?
Posted Using LeoFinance Beta