Hive Financial Statistics – 2022.02.04

Welcome to the daily financial report about the Hive blockchain.
All the information presented in this report is based on the data collected from the blockchain until 2022-02-04 midnight UTC. This report aims to provide you with a clear view of what is happening on the Hive blockchain.
 Este post está traducido al español - aquí
 Dieser Beitrag ist ins Deutsche übersetzt - hier
 Une version en français de ce post est disponible - ici
1. Price
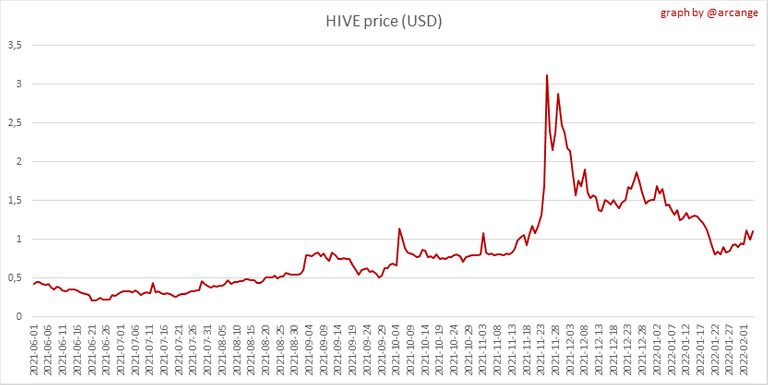 | 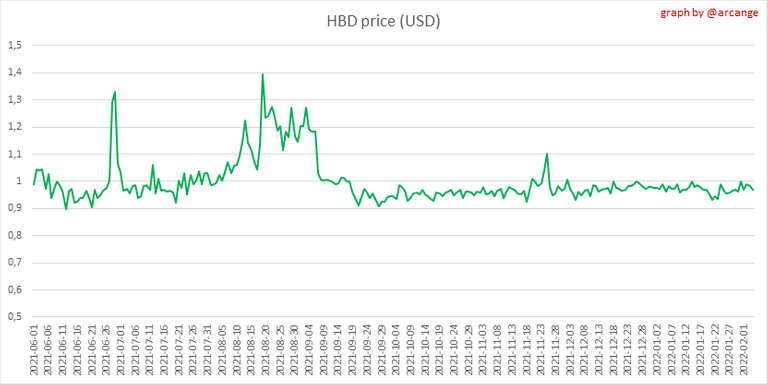 |
These graphs show the evolution of prices in USD for HIVE and HBD.
2. Supply

This graph shows the evolution of HIVE virtual Supply. The virtual supply is the sum of HIVE supply (liquid and staked HIVE) and HBD supply (converted into HIVE).
The graph also displays the debt ratio (HBD supply / HIVE virtual supply). Keep in mind that since hardfork 24 funds in the treasury (@hive.fund HBD balance) don't count towards the HBD debt ratio.
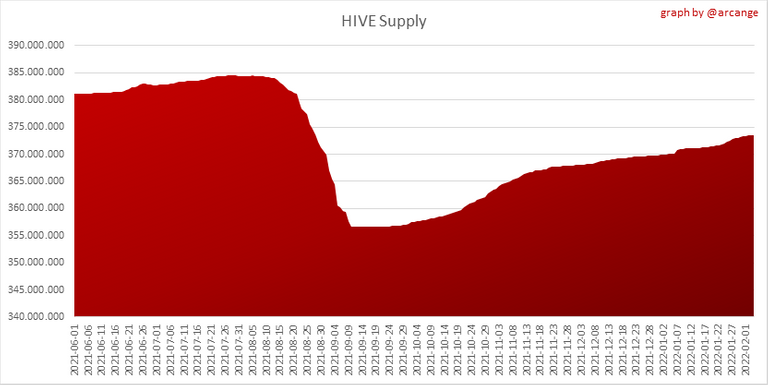 |  |
These graphs show the evolution of the HIVE Supply (both liquid and staked) and the HBD supply.
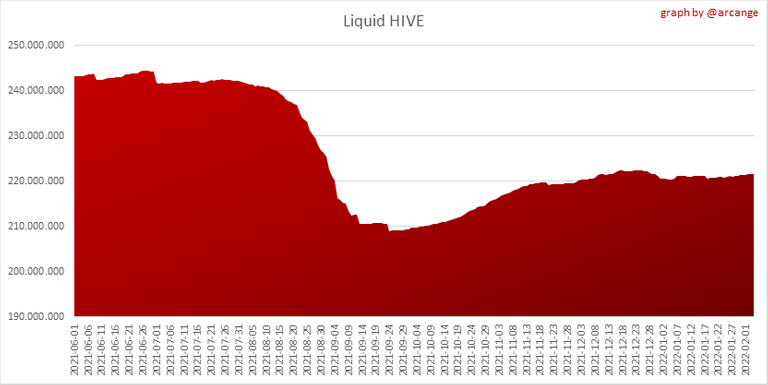 |  |
These charts show the evolution of the liquid HIVE and the staked HIVE (Hive Power).

This graph shows the overall Hive tokens distribution.
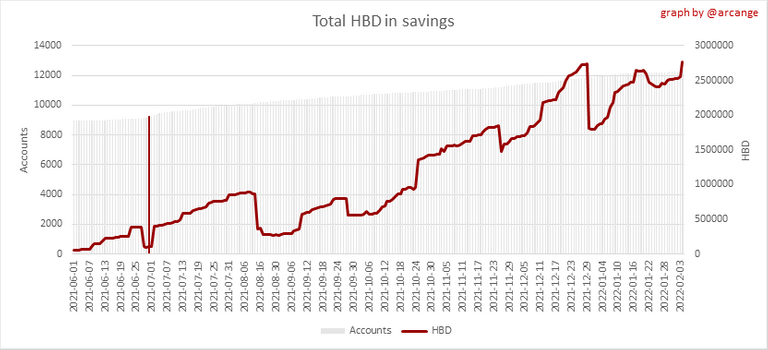
3. HBD Savings
| Account | Deposit | Account | Withdrawal |
|---|---|---|---|
| @alpha | 229,952.492 HBD | @emeka4 | 90.583 HBD |
| @hbdsavings | 2,049.596 HBD | @acont | 72.000 HBD |
| @muenchen | 1,689.131 HBD | @iamjohn | 21.247 HBD |
| @moleah | 400.000 HBD | @rukeros | 19.979 HBD |
| @chesatochi | 381.010 HBD | @badtripz | 16.239 HBD |
| @hiveauth | 324.984 HBD | @vickoly | 12.000 HBD |
| @ironshield | 260.086 HBD | @kapitanrosomak | 9.551 HBD |
| @funnyman | 200.087 HBD | @adcoinhive | 7.813 HBD |
| @onthewayout | 200.044 HBD | @tuwailib | 6.427 HBD |
| @hivechain.app | 189.984 HBD | @andres007sil | 4.508 HBD |
This graph shows how much and how many accounts store HBD in savings. The table below shows the topmost HBD deposits and withdrawals of the day.
Note: As of 2021-06-30 (HF25) interest is only paid for HBD which are stored in savings.
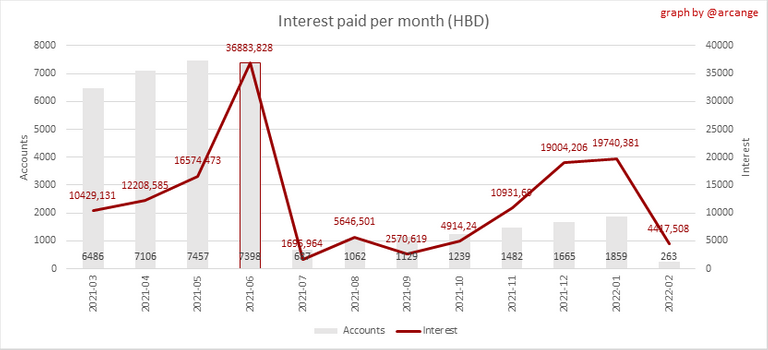
This chart shows the amount of interest paid each month for holding HBD and how many accounts received such interest.
4. Balances
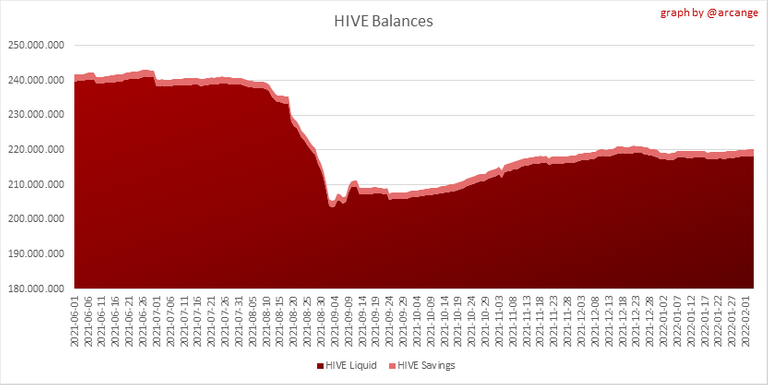
This graph shows the number of HIVE, both liquid and in savings, held by all accounts.

This graph shows the number of HBD, both liquid and in savings, held by all accounts.
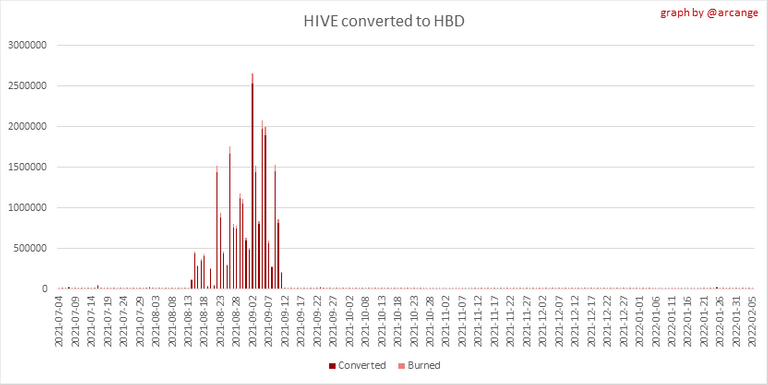
5. Conversions
Note: As a reminder, conversion requests are only finalized after 3 days. It is only then that it is known exactly how many HIVE were burned in return for the HBD received at the time of the conversion request.

This graph shows the number of HIVE collateralized due to requests to convert HIVE to HBD over the past few days.
 | 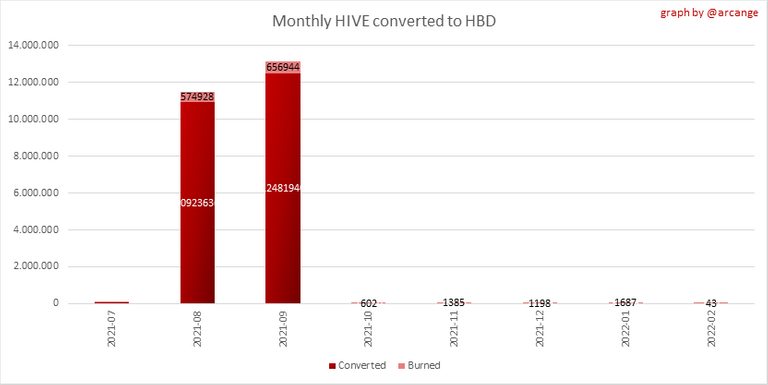 |
These graphs show the number of HIVE effectively used by the conversion process (HIVE converted and 5% HIVE fee which is burned) each day and month when requests to convert HIVE to HBD have been finalized.
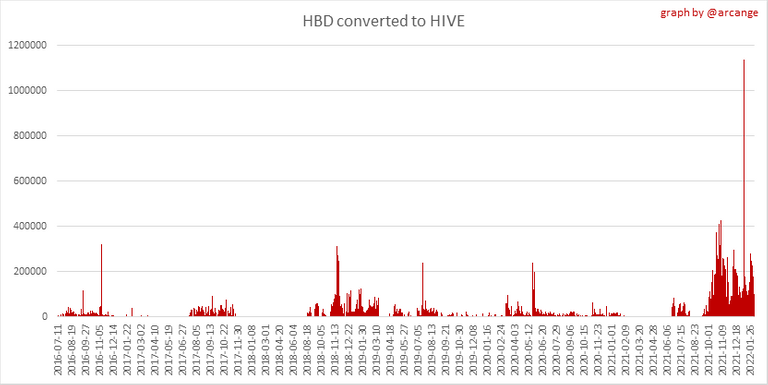 | 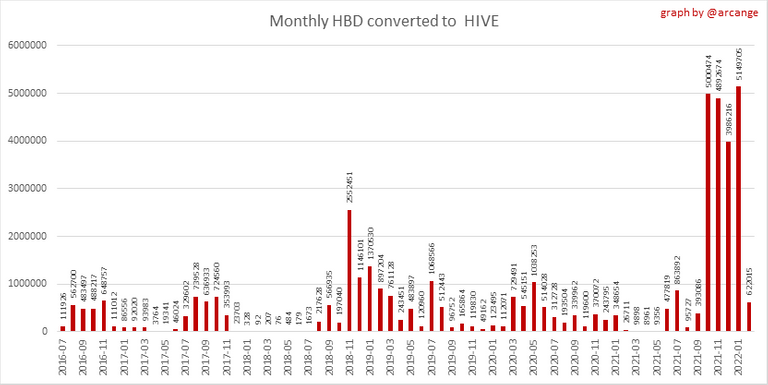 |
These graphs show the number of HBD burned, each day and each month, following requests to convert HBD to HIVE.
6. Powerup and Powerdown

| Date | Account | Amount |
|---|---|---|
| 2022-02-04 10:36:54 | @urri2020 | 33,284.560 HIVE |
| 2022-02-04 04:14:00 | @hivefolks | 15,543.853 HIVE |
| 2022-02-04 07:21:33 | @deepu7 | 7,001.588 HIVE |
| 2022-02-04 12:58:18 | @ssg-community | 4,575.416 HIVE |
| 2022-02-04 11:34:36 | @hlezama | 2,543.331 HIVE |
| 2022-02-04 08:01:36 | @priyanarc | 2,524.265 HIVE |
| 2022-02-04 11:25:27 | @glowshine | 2,234.157 HIVE |
| 2022-02-04 07:04:57 | @slwzl | 1,621.712 HIVE |
| 2022-02-04 09:03:21 | @lqch | 1,400.055 HIVE |
| 2022-02-04 08:54:00 | @antoniojoseha | 1,311.785 HIVE |
This graph and table show the amount of powerdown initiated over the last 7 days, and the largest initiated on this day.
| Account | Powerup | Account | Powerdown |
|---|---|---|---|
| @dagger212 | 4,576.976 HIVE | @arpolkin | 15,575.179 HIVE |
| @prosocialise | 4,010.000 HIVE | @b0y2k | 7,523.506 HIVE |
| @marcmh666 | 1,978.189 HIVE | @blewitt | 6,009.920 HIVE |
| @jphamer1 | 1,885.990 HIVE | @dhimmel | 4,130.120 HIVE |
| @holdonla | 1,355.336 HIVE | @borivan | 3,649.122 HIVE |
| @risingstargame | 1,000.000 HIVE | @leofinance | 2,524.900 HIVE |
| @ecoinstats | 676.000 HIVE | @tipu | 2,085.123 HIVE |
| @daveks | 467.100 HIVE | @rollie1212 | 2,057.143 HIVE |
| @ivangeevo | 410.338 HIVE | @emrebeyler | 2,005.483 HIVE |
| @luizeba | 254.562 HIVE | @demotruk | 1,967.236 HIVE |
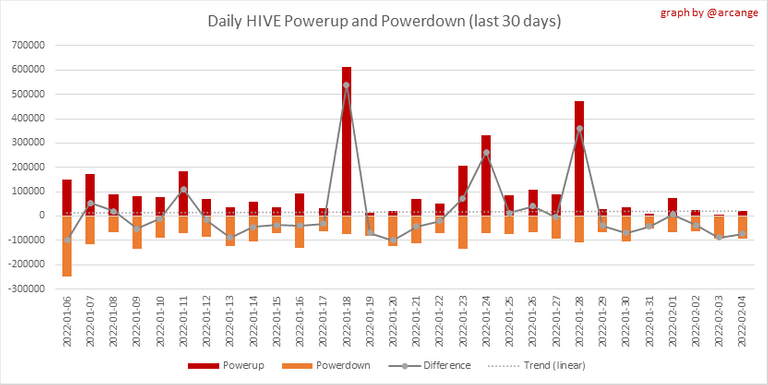
This graph shows the daily HIVE power-up, power-down, and the resulting variation over the last 30 days. The table shows the topmost power-ups and power-downs of the day.
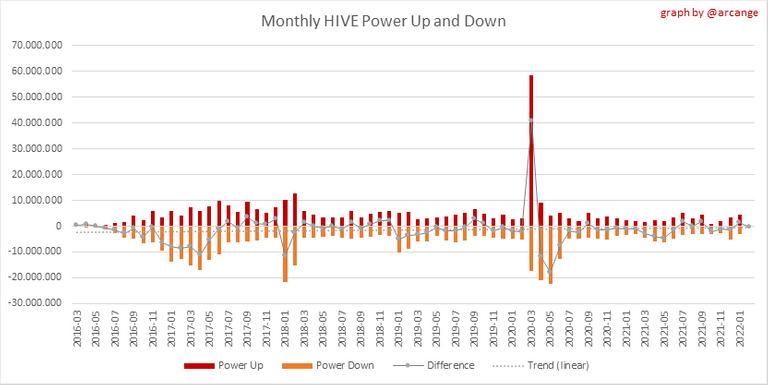
This graph shows the monthly HIVE power-up, power-down and the resulting variation.
Values for the last 3 months
| Period | Powerup | Powerdown | Difference |
|---|---|---|---|
| 2022-02 | 124,929.000 | 316,831.000 | -191,902.000 |
| 2022-01 | 4,573,937.000 | 3,082,577.000 | 1,491,360.000 |
| 2021-12 | 3,561,589.000 | 5,121,574.000 | -1,559,985.000 |
7. Transfers
These graphs show the volume (in USD) of HIVE and HBD transferred between accounts.
8. Exchanges
 | 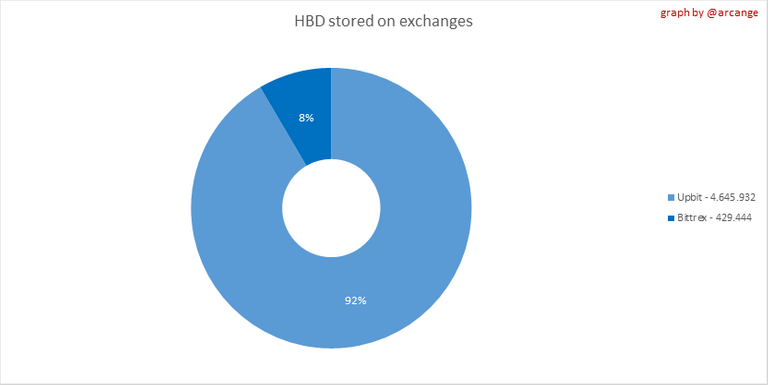 |
These graphs show the amount and distribution of HIVE and HBD stored on the exchanges where they are listed.
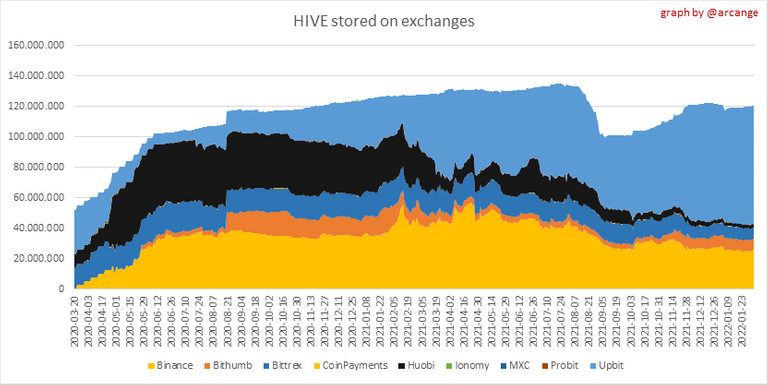 | 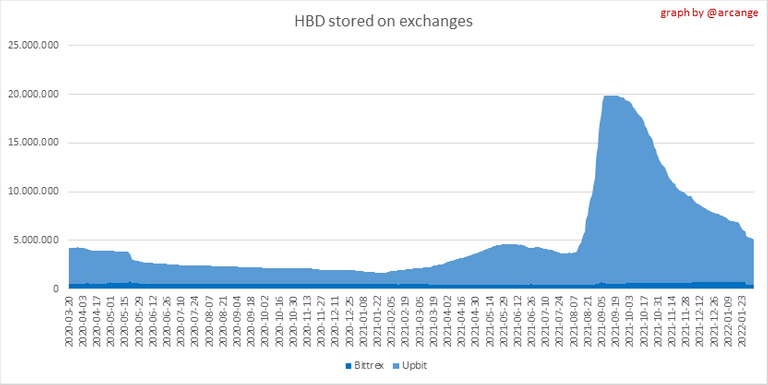 |
These graphs show the daily evolution of HIVE and HBD stored on the exchanges where they are listed.
I hope you find those stats useful. If you would like to see additional stats, feel free to drop me a comment. Your feedback is than welcome.
Thanks for reading.
Check out my apps and services


Electronic-terrorism, voice to skull and neuro monitoring on Hive and Steem. You can ignore this, but your going to wish you didnt soon. This is happening whether you believe it or not. https://ecency.com/fyrstikken/@fairandbalanced/i-am-the-only-motherfucker-on-the-internet-pointing-to-a-direct-source-for-voice-to-skull-electronic-terrorism
Very happy to see hive finally UP. also whole market
Have a !PIZZA
PIZZA Holders sent $PIZZA tips in this post's comments:
@steem82868(7/10) tipped @arcange (x1)
Learn more at https://hive.pizza.
Excellent report! I know from previous experiences that this type of post involves a lot of work, even more so when it comes to financial analysis. On the other hand, here is a well-developed work. In my opinion this post should be valued very well by the community!
Posted using Dapplr
Thank you @ebermudez