Hive Financial Statistics – 2021.11.08

Welcome to the daily financial report about the Hive blockchain.
All the information presented in this report is based on the data collected from the blockchain until 2021-11-08 midnight UTC. This report aims to provide you with a clear view of what is happening on the Hive blockchain.
 Este post está traducido al español - aquí
 Dieser Beitrag ist ins Deutsche übersetzt - hier
 Une version en français de ce post est disponible - ici
1. Price
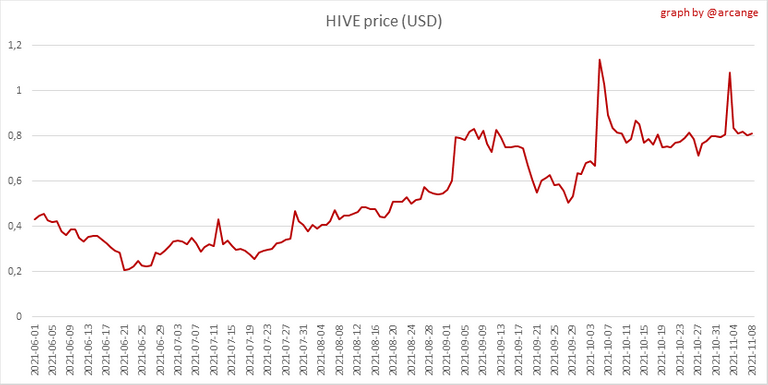 | 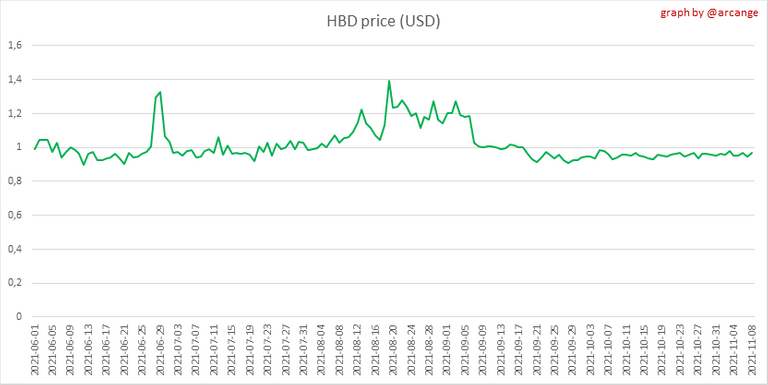 |
These graphs show the evolution of prices in USD for HIVE and HBD.
2. Supply
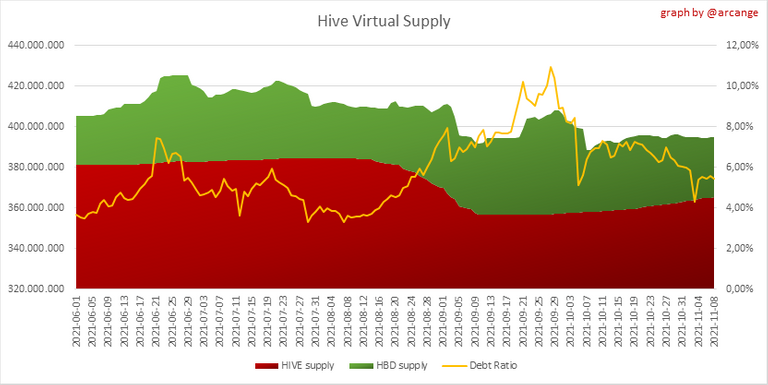
This graph shows the evolution of HIVE virtual Supply. The virtual supply is the sum of HIVE supply (liquid and staked HIVE) and HBD supply (converted into HIVE).
The graph also displays the debt ratio (HBD supply / HIVE virtual supply). Keep in mind that since hardfork 24 funds in the treasury (@hive.fund HBD balance) don't count towards the HBD debt ratio.
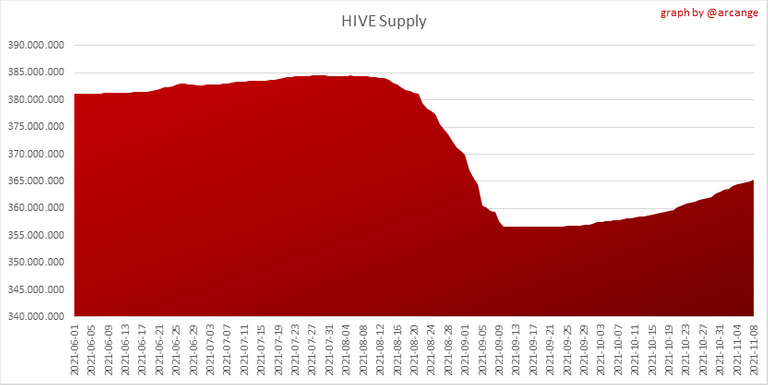 | 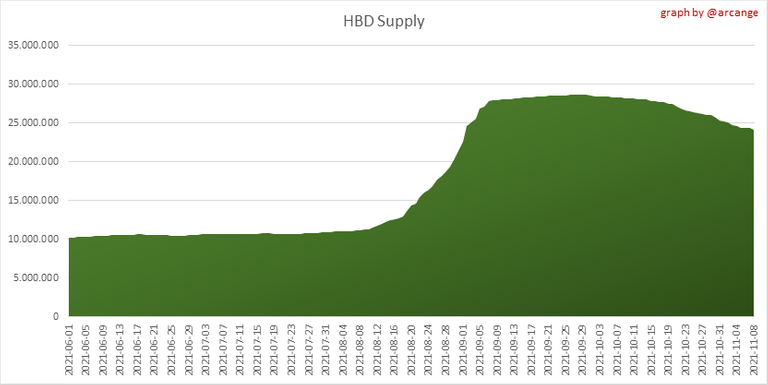 |
These graphs show the evolution of the HIVE Supply (both liquid and staked) and the HBD supply.
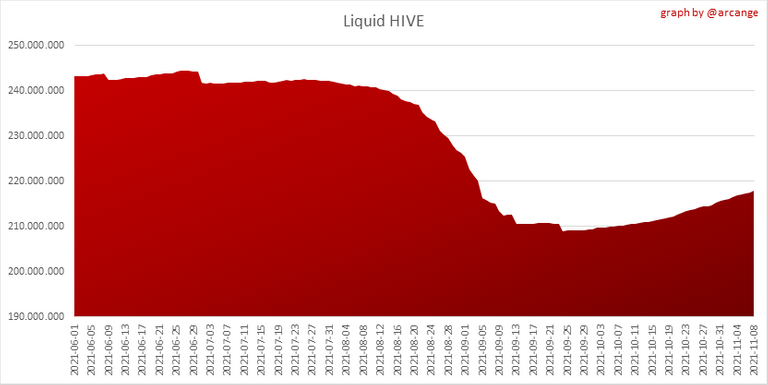 | 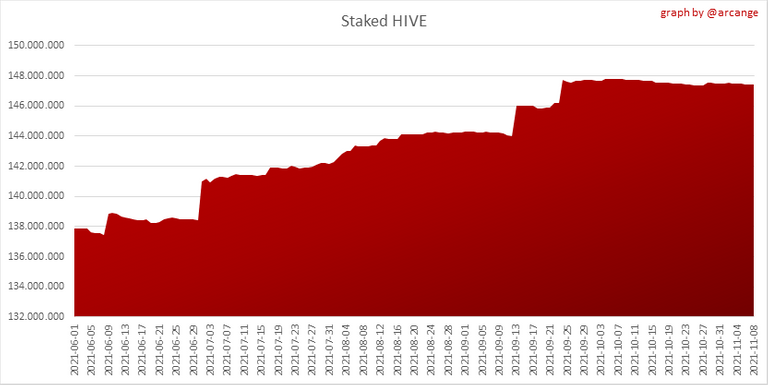 |
These charts show the evolution of the liquid HIVE and the staked HIVE (Hive Power).
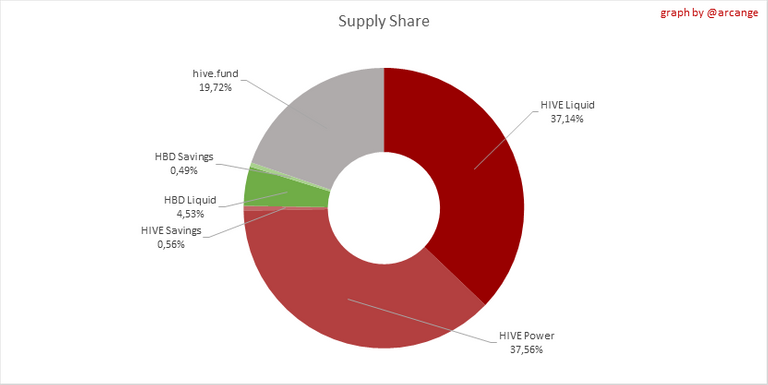
This graph shows the overall Hive tokens distribution.
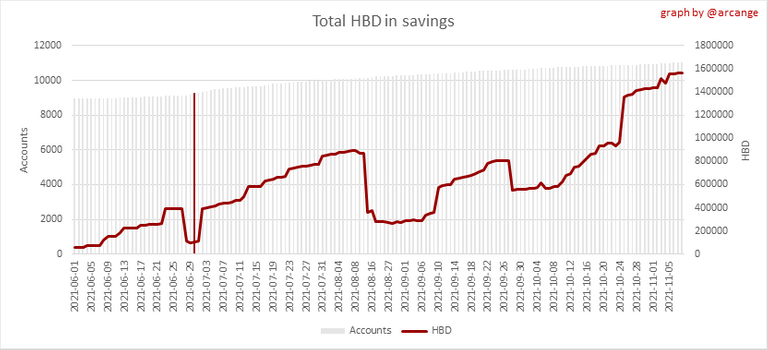
3. HBD Savings
Note: As of 2021-06-30 (HF25) interest is only paid for HBD which are stored in savings.
| Account | Deposit | Account | Withdrawal |
|---|---|---|---|
| @geekgirl | 495.916 HBD | @gr33nm4ster | 267.174 HBD |
| @yunnie | 289.567 HBD | @ogre-radio | 82.115 HBD |
| @tipu | 269.997 HBD | @elbrava | 34.887 HBD |
| @apolymask | 193.988 HBD | @priyanarc | 22.000 HBD |
| @hiveauth | 175.000 HBD | @donald.porter | 7.594 HBD |
| @guurry | 166.427 HBD | @kittima | 3.082 HBD |
| @garlet | 150.000 HBD | @gugumarino | 1.000 HBD |
| @cryptobrewmaster | 149.970 HBD | @noichavez | 0.396 HBD |
| @hispapro | 142.141 HBD | @steamloled | 0.300 HBD |
| @levi-miron | 100.000 HBD | @warliezdiaz1 | 0.126 HBD |
This graph shows how much and how many accounts store HBD in savings. The table below shows the topmost HBD deposits and withdrawals of the day.
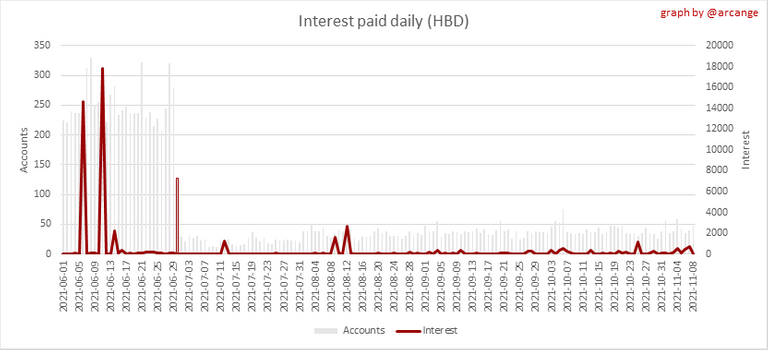
This chart shows the amount of interest paid each day for holding HBD and how many accounts received such interest.
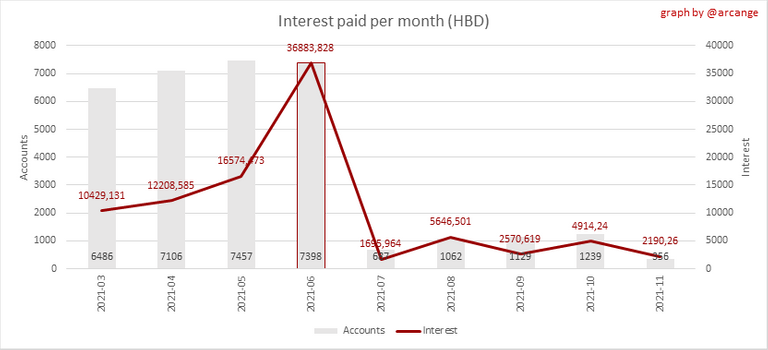
This chart is the same as the previous one, but data are grouped by month.
4. Balances
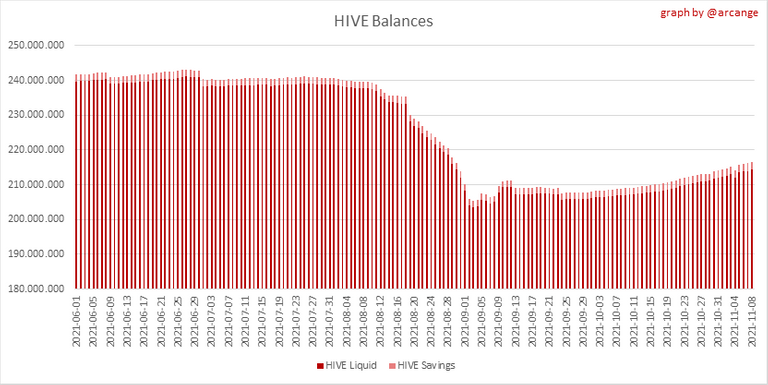
This graph shows the number of HIVE, both liquid and in savings, held by all accounts.
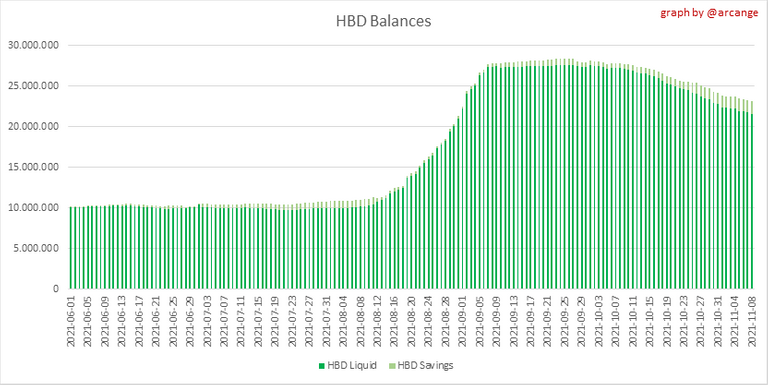
This graph shows the number of HBD, both liquid and in savings, held by all accounts.
5. Conversions
Note: As a reminder, conversion requests are only finalized after 3 days. It is only then that it is known exactly how many HIVE were burned in return for the HBD received at the time of the conversion request.
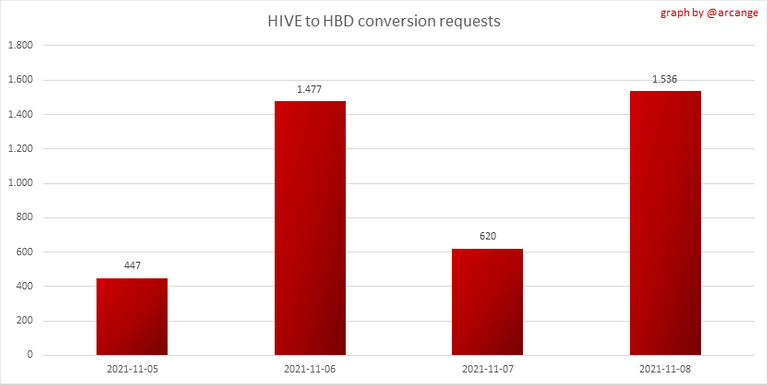
This graph shows the number of HIVE collateralized due to requests to convert HIVE to HBD over the past few days.
 | 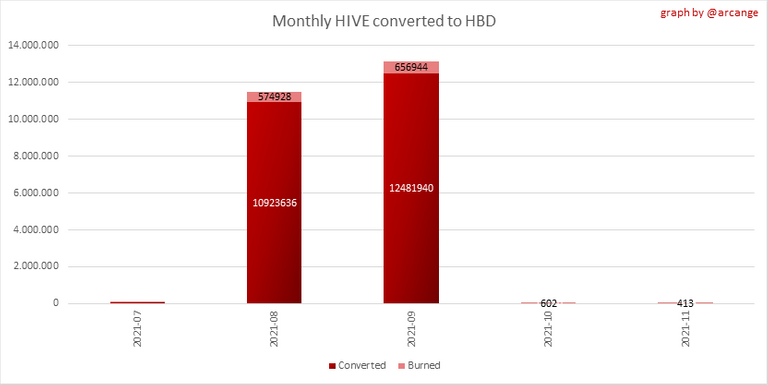 |
These graphs show the number of HIVE effectively used by the conversion process (HIVE converted and 5% HIVE fee which is burned) each day and month when requests to convert HIVE to HBD have been finalized.
 | 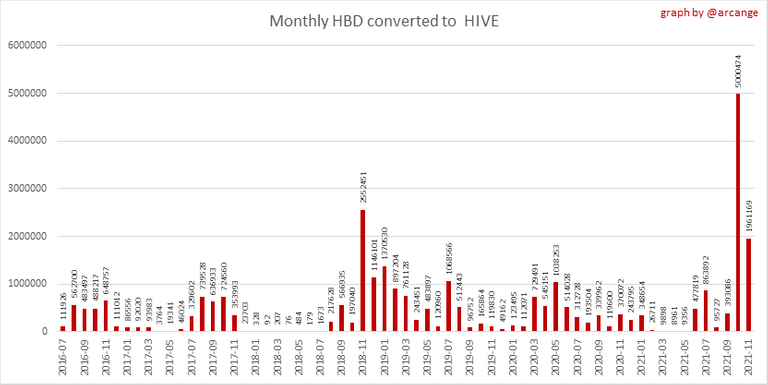 |
These graphs show the number of HBD burned, each day and each month, following requests to convert HBD to HIVE.
6. Powerup and Powerdown

| Date | Account | Amount |
|---|---|---|
| 2021-11-08 04:41:45 | @edicted | 130,007.647 HIVE |
| 2021-11-08 12:46:27 | @demotruk | 18,151.565 HIVE |
| 2021-11-08 08:51:51 | @badtman | 15,280.817 HIVE |
| 2021-11-08 11:24:03 | @dune69 | 12,123.930 HIVE |
| 2021-11-08 11:24:54 | @caladan | 11,424.876 HIVE |
| 2021-11-08 10:59:45 | @pab.ink | 5,709.446 HIVE |
| 2021-11-08 08:41:33 | @bearbear613 | 5,189.352 HIVE |
| 2021-11-08 03:21:27 | @marybellrg | 4,151.433 HIVE |
| 2021-11-08 04:41:18 | @kaminchan | 2,874.560 HIVE |
| 2021-11-08 04:40:57 | @kaminchan | 2,874.560 HIVE |
This graph and table show the amount of powerdown initiated over the last 7 days, and the largest initiated on this day.

| Account | Powerup | Account | Powerdown |
|---|---|---|---|
| @demotruk | 6,500.000 HIVE | @gringalicious | 14,915.332 HIVE |
| @jarvie | 5,000.000 HIVE | @peakd | 12,342.798 HIVE |
| @utopis | 3,000.000 HIVE | @aggroed | 6,944.366 HIVE |
| @laruche | 2,615.193 HIVE | @chronocrypto | 5,303.789 HIVE |
| @escornico | 1,090.990 HIVE | @roelandp | 3,354.415 HIVE |
| @alexko-steemit | 1,000.000 HIVE | @xxxxxxxxxx | 3,240.914 HIVE |
| @evilwhiskaz | 690.000 HIVE | @eric818 | 2,930.213 HIVE |
| @reseller | 620.240 HIVE | @leo.voter | 1,901.173 HIVE |
| @piotrgrafik | 530.000 HIVE | @innerhive | 1,558.624 HIVE |
| @genet | 498.750 HIVE | @ecoinstant | 1,502.568 HIVE |
This graph shows the daily HIVE power-up, power-down, and the resulting variation over the last 30 days. The table shows the topmost power-ups and power-downs of the day.
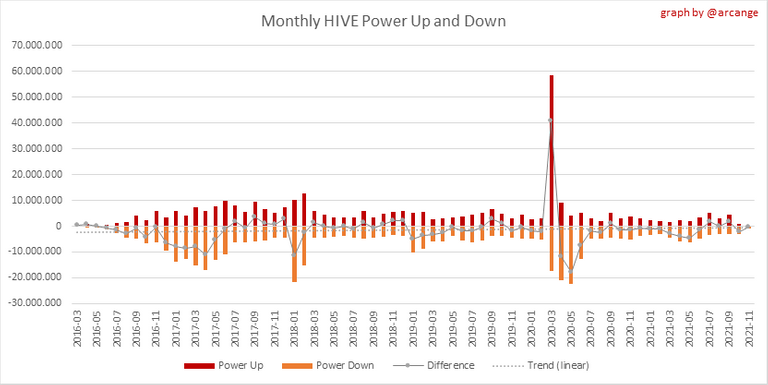
This graph shows the monthly HIVE power-up, power-down and the resulting variation.
Values for the last 3 months
| Period | Powerup | Powerdown | Difference |
|---|---|---|---|
| 2021-11 | 233,753.000 | 766,668.000 | -532,915.000 |
| 2021-10 | 951,900.000 | 3,051,364.000 | -2,099,464.000 |
| 2021-09 | 4,552,777.000 | 2,892,984.000 | 1,659,793.000 |
7. Transfers
These graphs show the volume (in USD) of HIVE and HBD transferred between accounts.
8. Exchanges
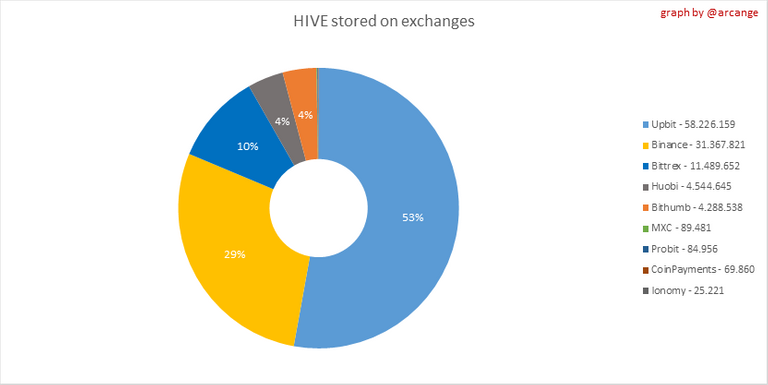 | 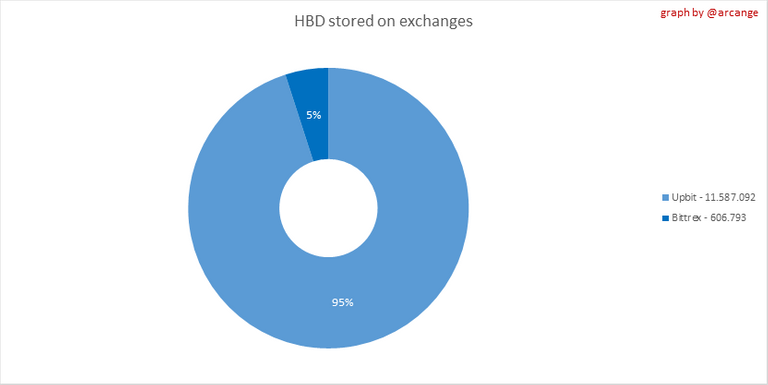 |
These graphs show the amount and distribution of HIVE and HBD stored on the exchanges where they are listed.
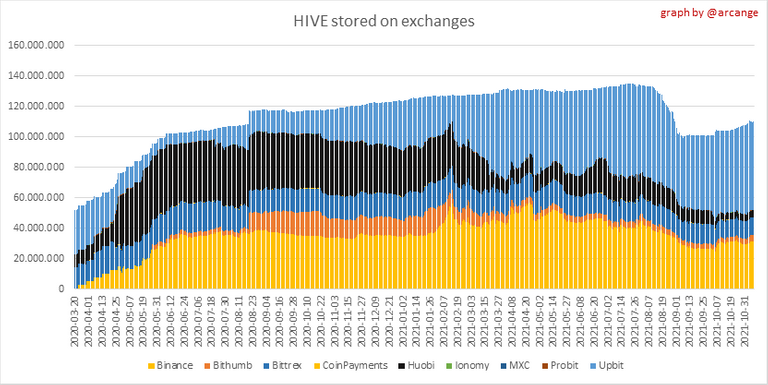 | 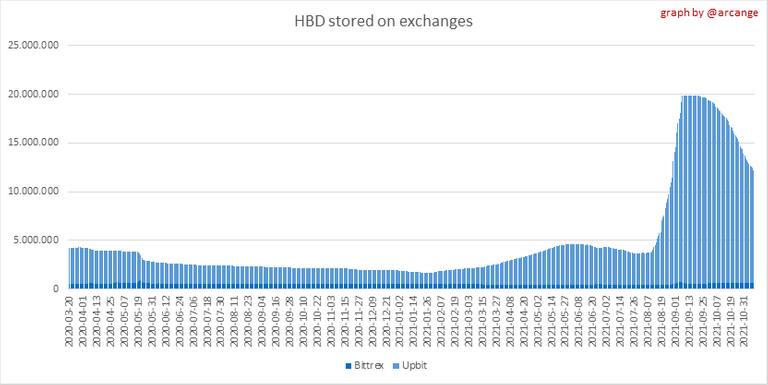 |
These graphs show the daily evolution of HIVE and HBD stored on the exchanges where they are listed.
I hope you find those stats useful. If you would like to see additional stats, feel free to drop me a comment. Your feedback is than welcome.
Thanks for reading.

Check out my apps and services


View or trade
BEER.Hey @arcange, here is a little bit of
BEERfrom @pixresteemer for you. Enjoy it!Did you know that you can use BEER at dCity game to **buy dCity NFT cards** to rule the world.
Congratulations @arcange! You have completed the following achievement on the Hive blockchain and have been rewarded with new badge(s):
Your next target is to reach 5800 posts.
You can view your badges on your board and compare yourself to others in the Ranking
If you no longer want to receive notifications, reply to this comment with the word
STOPTo support your work, I also upvoted your post!
Check out the last post from @hivebuzz:
Always doing the best boss on the statistics table @arcange