Hive Financial Statistics – 2021.10.02

Welcome to the daily financial report about the Hive blockchain.
All the information presented in this report is based on the data collected from the blockchain until 2021-10-02 midnight UTC. This report aims to provide you with a clear view of what is happening on the Hive blockchain.
 Este post está traducido al español - aquí
 Dieser Beitrag ist ins Deutsche übersetzt - hier
 Une version en français de ce post est disponible - ici
1. Price
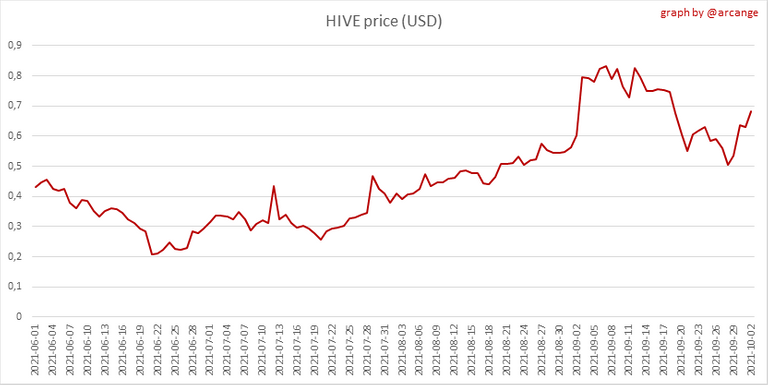 |  |
These graphs show the evolution of prices in USD for HIVE and HBD.
2. Supply

This graph shows the evolution of HIVE virtual Supply. The virtual supply is the sum of HIVE supply (liquid and staked HIVE) and HBD supply (converted into HIVE).
The graph also displays the debt ratio (HBD supply / HIVE virtual supply). Keep in mind that since hardfork 24 funds in the treasury (@hive.fund HBD balance) don't count towards the HBD debt ratio.
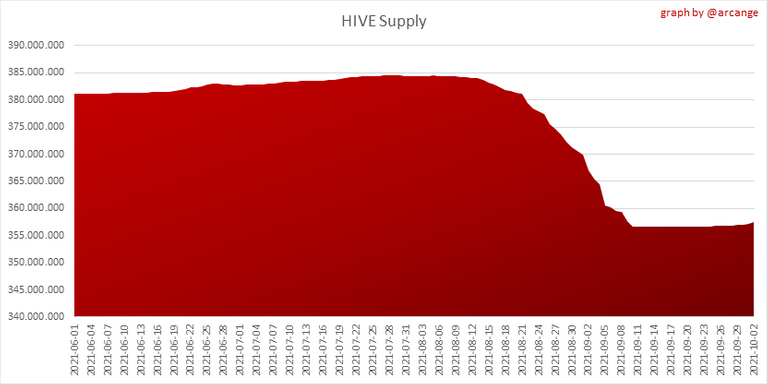 | 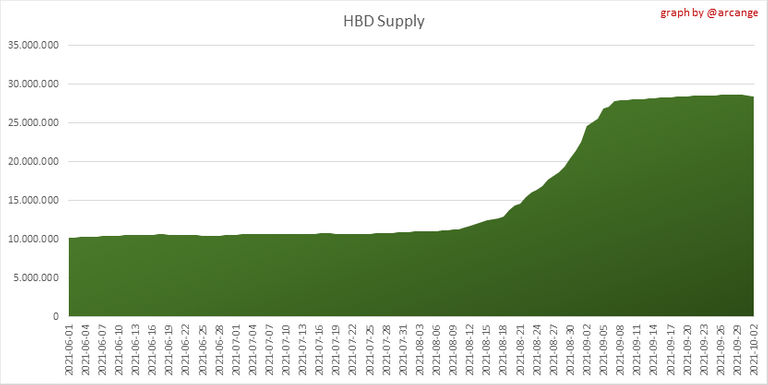 |
These graphs show the evolution of the HIVE Supply (both liquid and staked) and the HBD supply.
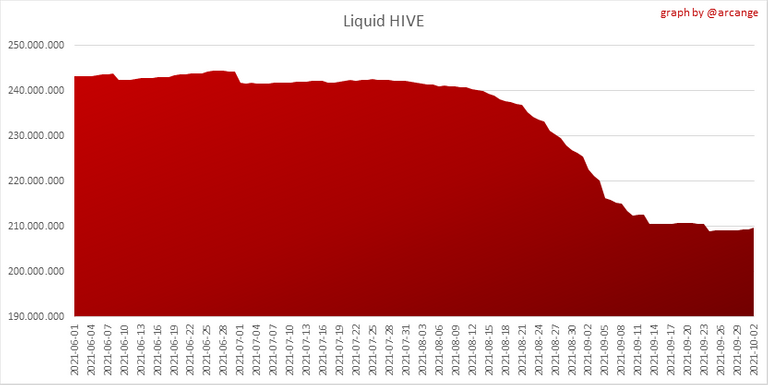 | 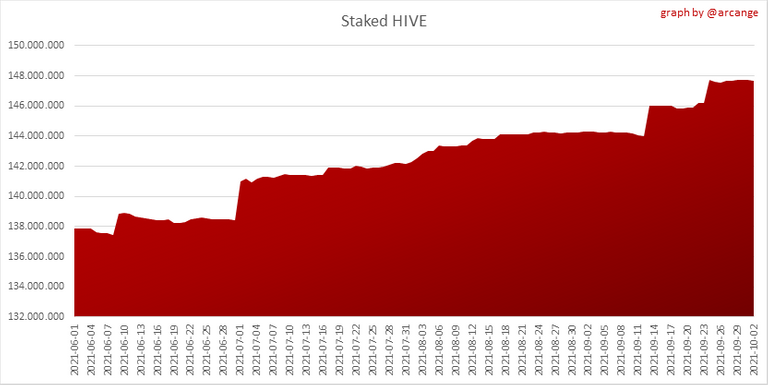 |
These charts show the evolution of the liquid HIVE and the staked HIVE (Hive Power).
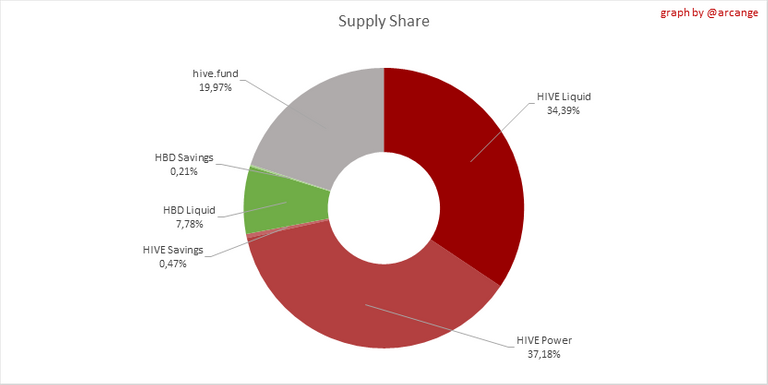
This graph shows the overall Hive tokens distribution.
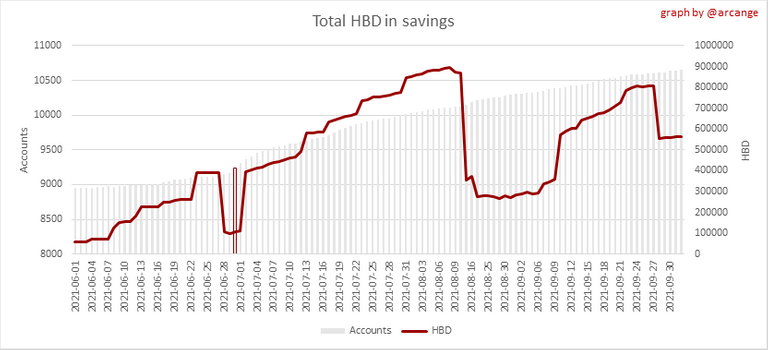
3. HBD Savings
Note: As of 2021-06-30 (HF25) interest is only paid for HBD which are stored in savings.
| Account | Deposit | Account | Withdrawal |
|---|---|---|---|
| @ctime | 1,500.002 HBD | @gungunkrishu | 207.872 HBD |
| @hivevault | 245.809 HBD | @lizelle | 118.059 HBD |
| @lefty619 | 221.826 HBD | @mineopoly | 100.000 HBD |
| @buggedout | 149.636 HBD | @lightsplasher | 100.000 HBD |
| @aafeng | 135.657 HBD | @davescustommedia | 74.343 HBD |
| @einfachnathi | 134.036 HBD | @yems | 67.125 HBD |
| @hextech | 93.061 HBD | @formosa | 50.000 HBD |
| @faisalamin | 68.425 HBD | @heypuch | 17.000 HBD |
| @anthonyadavisii | 50.011 HBD | @sachingeorge | 11.000 HBD |
| @ilazramusic | 46.000 HBD | @hive-106316 | 9.155 HBD |
This graph shows how much and how many accounts store HBD in savings. The table below shows the topmost HBD deposits and withdrawals of the day.

This chart shows the amount of interest paid each day for holding HBD and how many accounts received such interest.
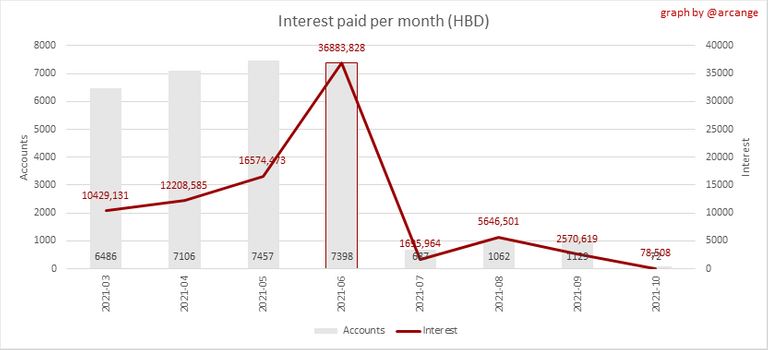
This chart is the same as the previous one, but data are grouped by month.
4. Balances
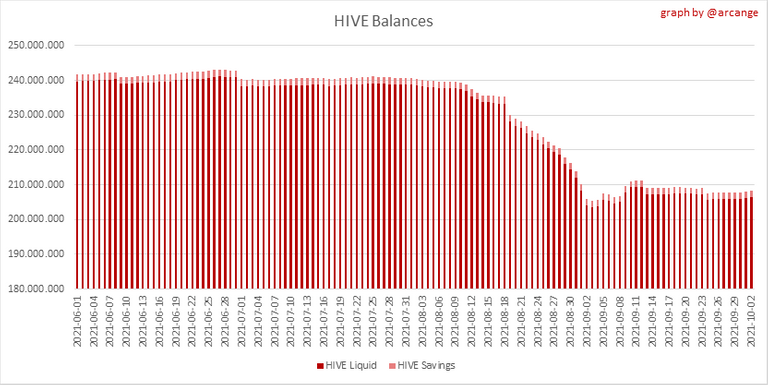
This graph shows the number of HIVE, both liquid and in savings, held by all accounts.
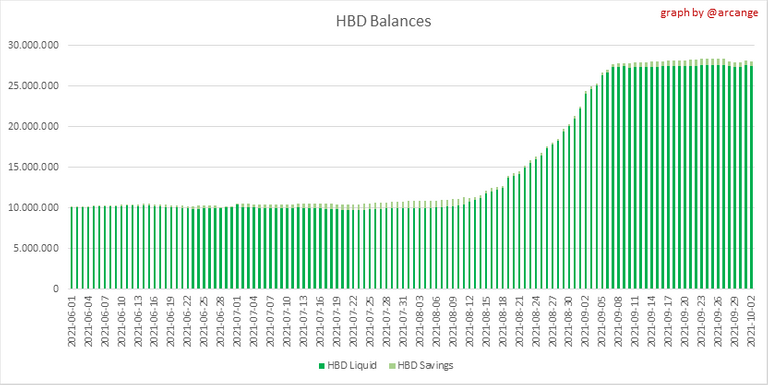
This graph shows the number of HBD, both liquid and in savings, held by all accounts.
5. Conversions
Note: As a reminder, conversion requests are only finalized after 3 days. It is only then that it is known exactly how many HIVE were burned in return for the HBD received at the time of the conversion request.
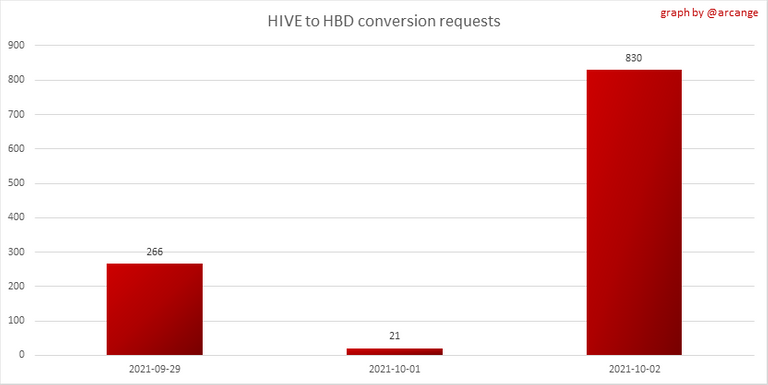
This graph shows the number of HIVE collateralized due to requests to convert HIVE to HBD over the past few days.
 | 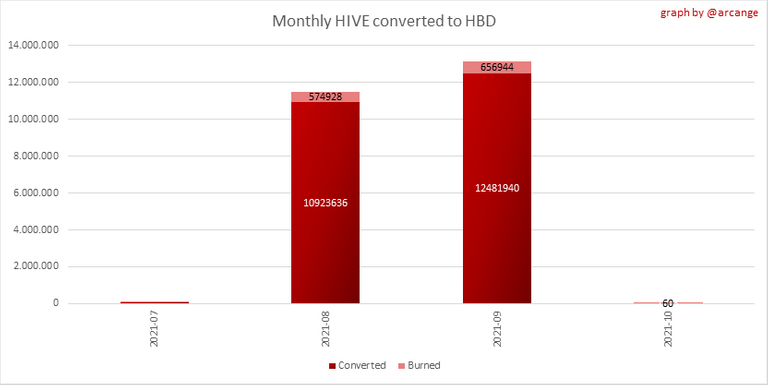 |
These graphs show the number of HIVE effectively used by the conversion process (HIVE converted and 5% HIVE fee which is burned) each day and month when requests to convert HIVE to HBD have been finalized.
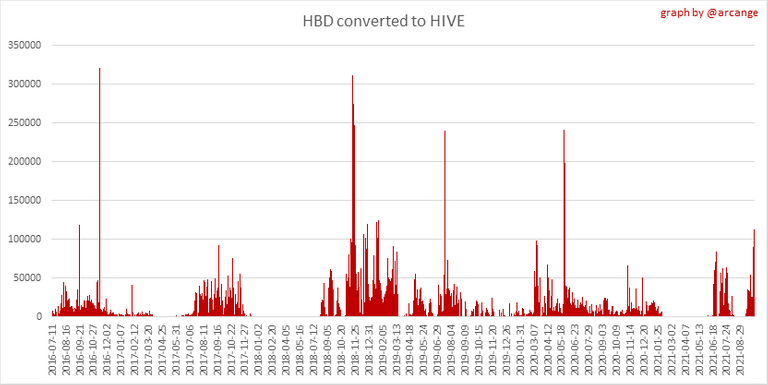 |  |
These graphs show the number of HBD burned, each day and each month, following requests to convert HBD to HIVE.
6. Powerup and Powerdown
| Date | Account | Amount |
|---|---|---|
| 2021-10-02 11:01:03 | @spt-skillup | 26,001.184 HIVE |
| 2021-10-02 03:00:03 | @onthewayout | 21,721.504 HIVE |
| 2021-10-02 06:26:33 | @txatxy | 10,524.202 HIVE |
| 2021-10-02 09:04:48 | @atheistrepublic | 7,778.502 HIVE |
| 2021-10-02 05:10:39 | @coriolanus1337 | 6,489.699 HIVE |
| 2021-10-02 02:53:03 | @coinomite | 5,244.709 HIVE |
| 2021-10-02 11:06:54 | @tungphong | 2,227.101 HIVE |
| 2021-10-02 01:48:48 | @stevejhuggett | 1,717.117 HIVE |
| 2021-10-02 08:14:48 | @crypto-is-a-scam | 1,694.320 HIVE |
| 2021-10-02 08:15:06 | @crypto-is-a-scam | 1,694.320 HIVE |
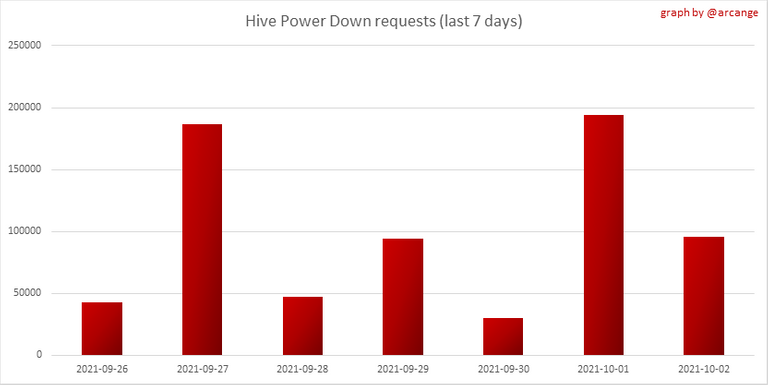
This graph and table show the amount of powerdown initiated over the last 7 days, and the largest initiated on this day.
| Account | Powerup | Account | Powerdown |
|---|---|---|---|
| @sam99 | 1,967.135 HIVE | @riverhead | 74,764.334 HIVE |
| @adacardano | 1,730.703 HIVE | @dhimmel | 13,698.130 HIVE |
| @optout | 1,400.000 HIVE | @buildawhale | 5,813.683 HIVE |
| @steemitboard | 1,177.101 HIVE | @talentclub | 4,000.855 HIVE |
| @everything-fine | 1,000.000 HIVE | @themonetaryfew | 3,942.000 HIVE |
| @deanliu | 995.000 HIVE | @omonomo | 3,818.705 HIVE |
| @hive-combine | 990.000 HIVE | @bdvoter | 3,554.155 HIVE |
| @tdre | 976.507 HIVE | @revisesociology | 2,383.967 HIVE |
| @isaria | 408.503 HIVE | @technological | 2,190.264 HIVE |
| @cyberdemon531 | 390.996 HIVE | @nonameslefttouse | 2,004.691 HIVE |
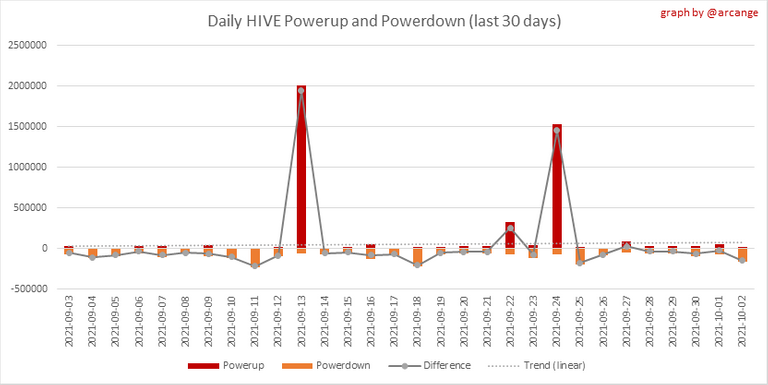
This graph shows the daily HIVE power-up, power-down, and the resulting variation over the last 30 days. The table shows the topmost power-ups and power-downs of the day.
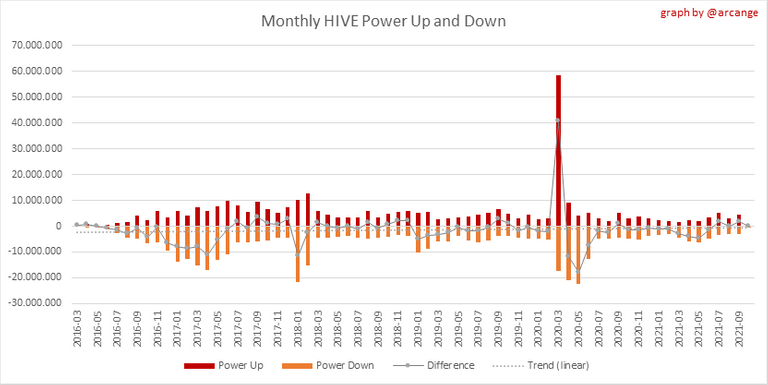
This graph shows the monthly HIVE power-up, power-down and the resulting variation.
Values for the last 3 months
| Period | Powerup | Powerdown | Difference |
|---|---|---|---|
| 2021-10 | 67,597.000 | 241,281.000 | -173,684.000 |
| 2021-09 | 4,552,777.000 | 2,892,984.000 | 1,659,793.000 |
| 2021-08 | 3,212,814.000 | 3,144,598.000 | 68,216.000 |
7. Transfers
These graphs show the volume (in USD) of HIVE and HBD transferred between accounts.
8. Exchanges
 | 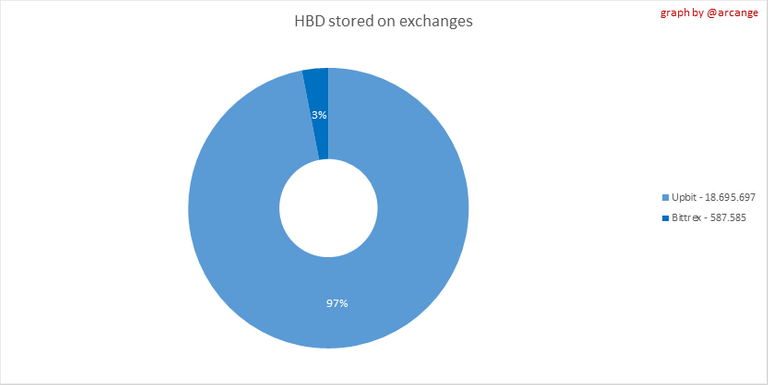 |
These graphs show the amount and distribution of HIVE and HBD stored on the exchanges where they are listed.
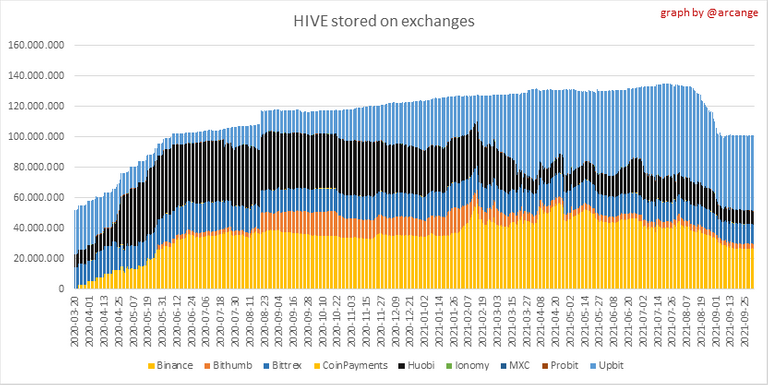 | 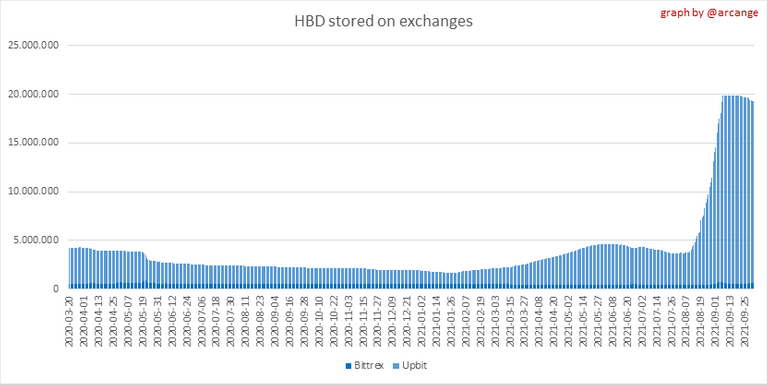 |
These graphs show the daily evolution of HIVE and HBD stored on the exchanges where they are listed.
I hope you find those stats useful. If you would like to see additional stats, feel free to drop me a comment. Your feedback is than welcome.
Thanks for reading.
Check out my apps and services


Thank you for the stats @arcange, I'm surprised not more people move their HBD to Savings? Every little bit counts!
With HBD being below $1, it might be a better opportunity to convert them to HIVE.
It all depends on your investment strategy.
Congratulations @arcange! You have completed the following achievement on the Hive blockchain and have been rewarded with new badge(s) :
Your next target is to reach 35000 replies.
You can view your badges on your board and compare yourself to others in the Ranking
If you no longer want to receive notifications, reply to this comment with the word
STOPCheck out the last post from @hivebuzz:
Your report is always elaborated and precisely forget it and from where anyone can gather the required information of any specific period of time. thank you very much for sharing continuously with all of your effort which is very much helpful for the readers.
Thank you @engrsayful
$WINE
Congratulations, @theguruasia You Successfully Shared 0.500 WINEX With @arcange.
You Earned 0.500 WINEX As Curation Reward.
You Utilized 5/5 Successful Calls.
Contact Us : WINEX Token Discord Channel
WINEX Current Market Price : 0.110
Hi Sir can you guide me how to store HBD in savings? what is ROI in HBD savings?
APR on savings is currently 10%
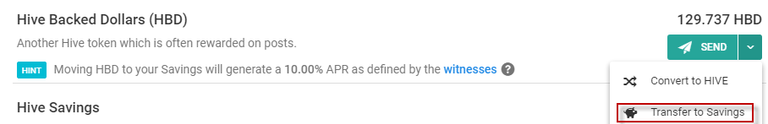
If you use peakd.com, to move HBD to your savings go to your wallet, click the send button and choose "transfer to savings":
Thanks for guidance Sir.
You're welcome @oxidil