Hive Financial Statistics – 2021.09.19

Welcome to the daily financial report about the Hive blockchain.
All the information presented in this report is based on the data collected from the blockchain until 2021-09-19 midnight UTC. This report aims to provide you with a clear view of what is happening on the Hive blockchain.
 Este post está traducido al español - aquí
 Dieser Beitrag ist ins Deutsche übersetzt - hier
 Une version en français de ce post est disponible - ici
1. Price
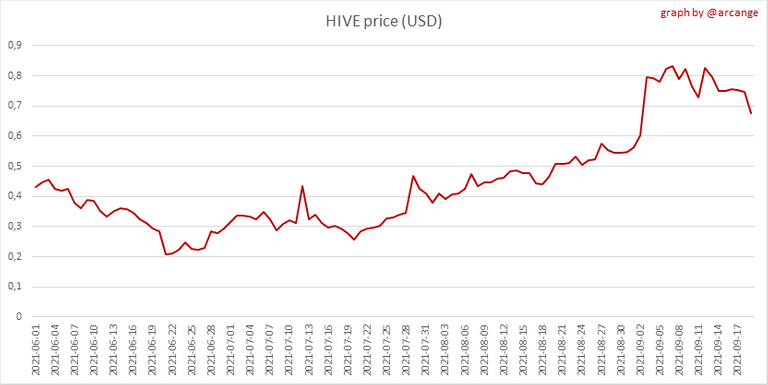 | 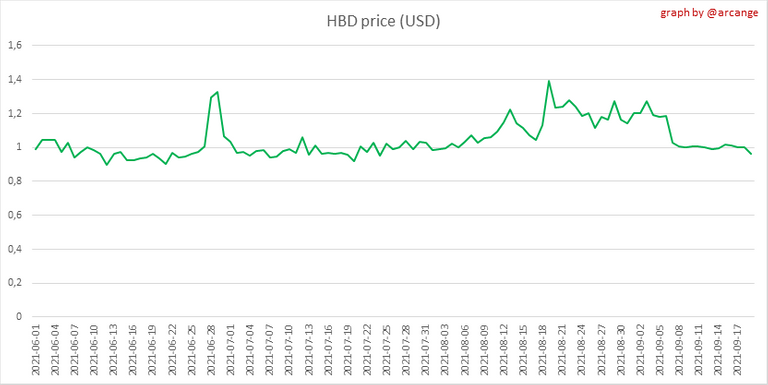 |
These graphs show the evolution of prices in USD for HIVE and HBD.
2. Supply
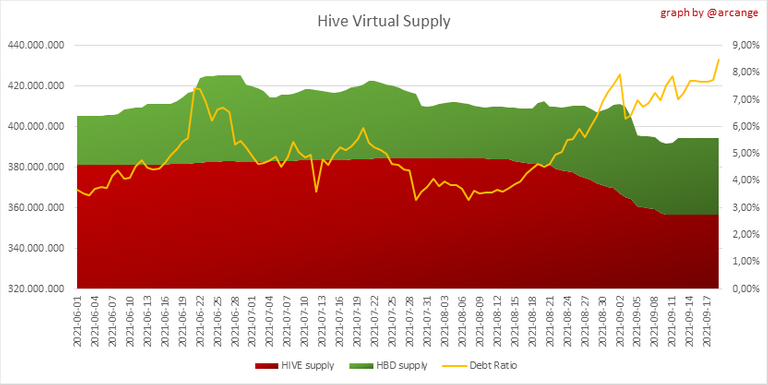
This graph shows the evolution of HIVE virtual Supply. The virtual supply is the sum of HIVE supply (liquid Or staked HIVE) and HBD supply (converted into HIVE).
The graph also displays the debt ratio (HBD supply / HIVE virtual supply). Keep in mind that since hardfork 24 funds in the treasury (@hive.fund HBD balance) don't count towards the HBD debt ratio.
 | 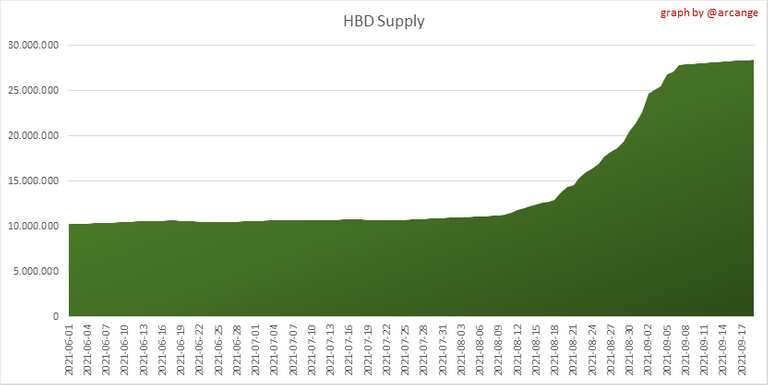 |
These graphs show the evolution of the HIVE Supply (both liquid and staked) and the HBD supply.
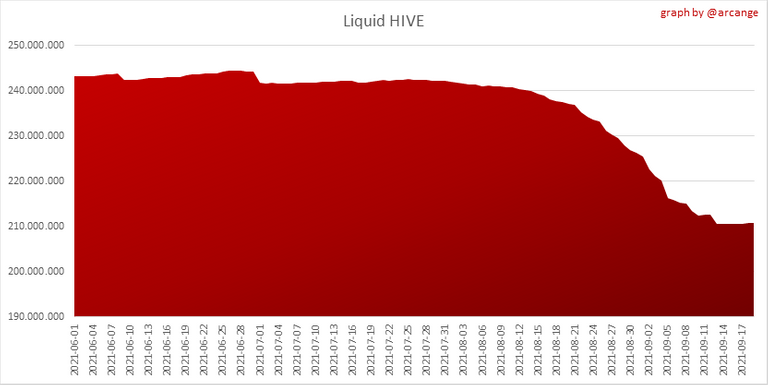 | 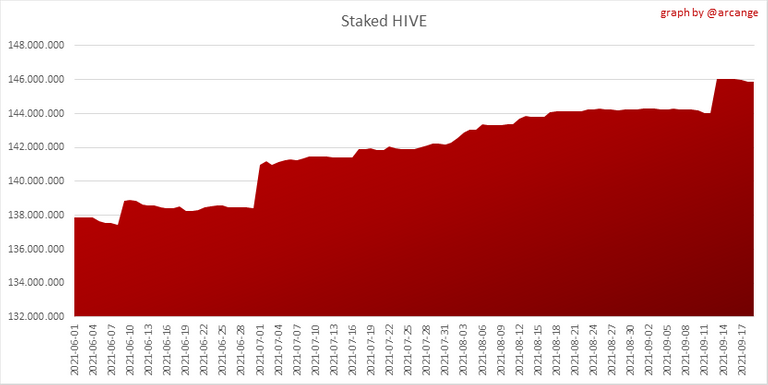 |
These charts show the evolution of the liquid HIVE and the staked HIVE (Hive Power).
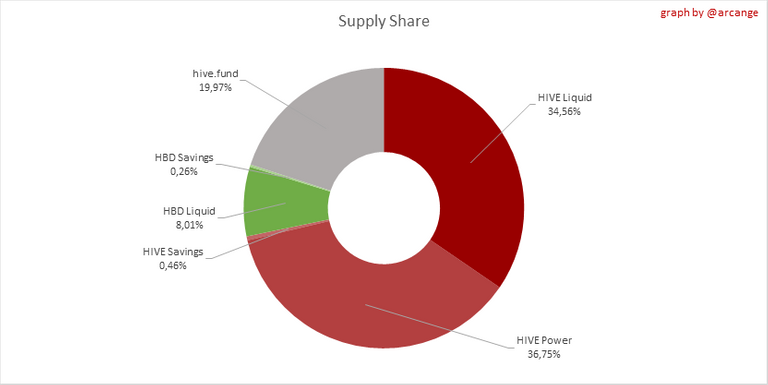
This graph shows the overall Hive tokens distribution.
3. HBD Savings
Note: As of 2021-06-30 (HF25) interest is only paid for HBD which are stored in savings.
| Account | Deposit | Account | Withdrawal |
|---|---|---|---|
| @xmauron3 | 2,964.317 HBD | @creativemary | 335.736 HBD |
| @mika | 1,100.000 HBD | @stashthief | 107.465 HBD |
| @sandymeyer | 600.000 HBD | @ericaliu | 100.000 HBD |
| @bucket1 | 203.153 HBD | @cowboyzlegend27 | 49.752 HBD |
| @ironshield | 201.000 HBD | @mima2606 | 8.624 HBD |
| @nostalgic1212 | 200.000 HBD | @ying82 | 8.437 HBD |
| @smooth | 135.539 HBD | @angie08 | 5.000 HBD |
| @lefty619 | 122.466 HBD | @birdwatcher | 3.682 HBD |
| @matt-archy | 113.088 HBD | @contrabourdon | 0.622 HBD |
| @muscara | 98.975 HBD | @audiohive-me | 0.480 HBD |
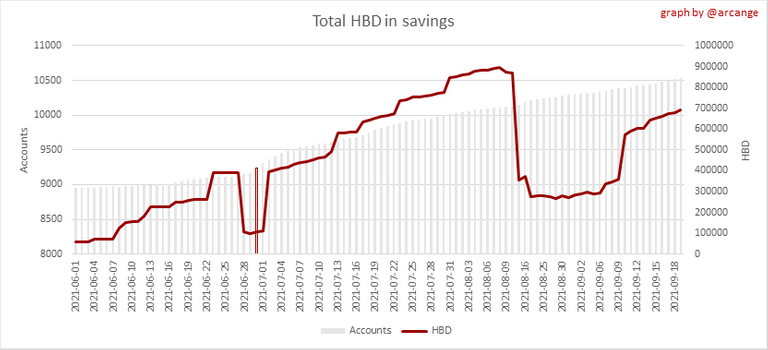
This graph shows how much and how many accounts store HBD in savings. The table below shows the topmost HBD deposits and withdrawals of the day.
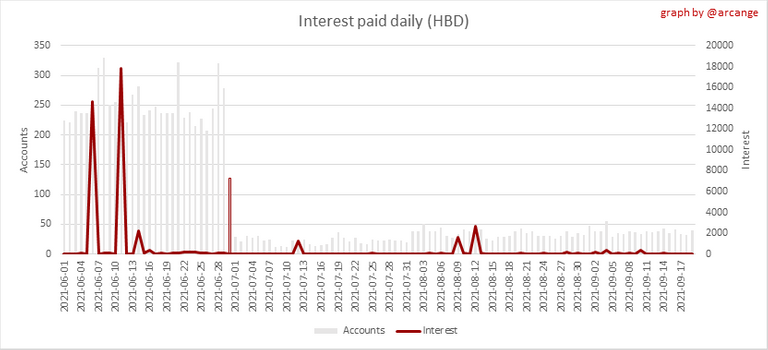
This chart shows the amount of interest paid each day for holding HBD and how many accounts received such interest.
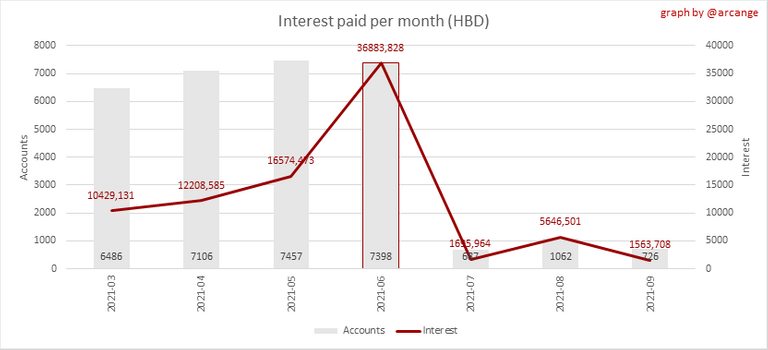
This chart is the same as the previous one, but data are grouped by month.
4. Balances
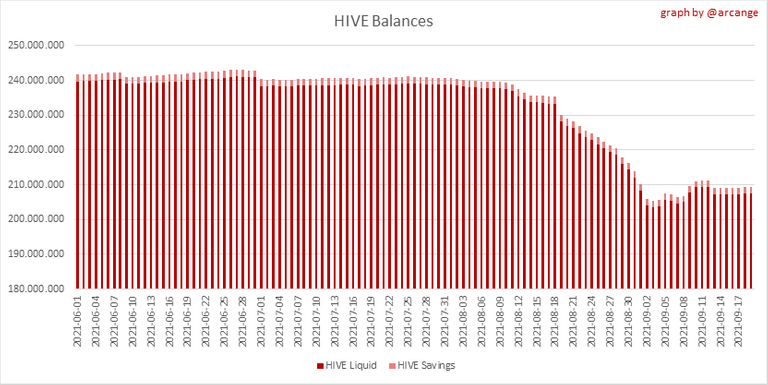
This graph shows the number of HIVE, both liquid and in savings, held by all accounts.
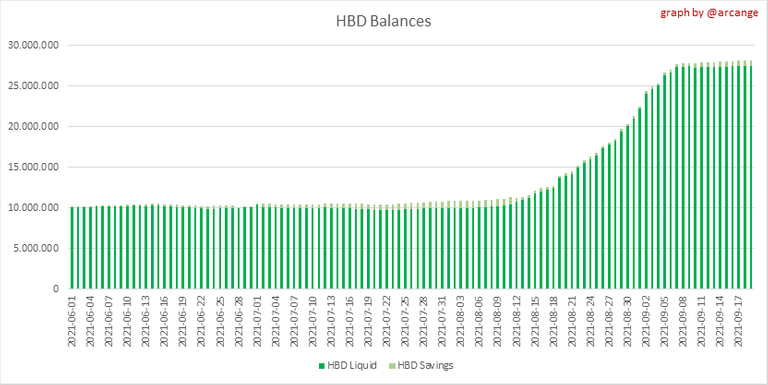
This graph shows the number of HBD, both liquid and in savings, held by all accounts.
5. Conversions
Note: As a reminder, conversion requests are only finalized after 3 days. It is only then that it is known exactly how many HIVE were burned in return for the HBD received at the time of the conversion request.
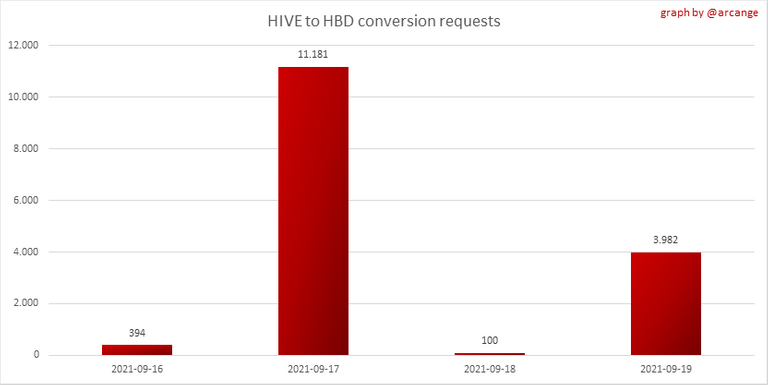
This graph shows the number of HIVE collateralized due to requests to convert HIVE to HBD over the past few days.
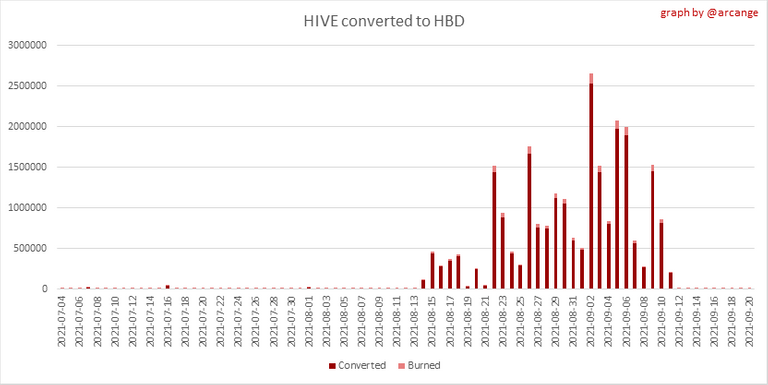 | 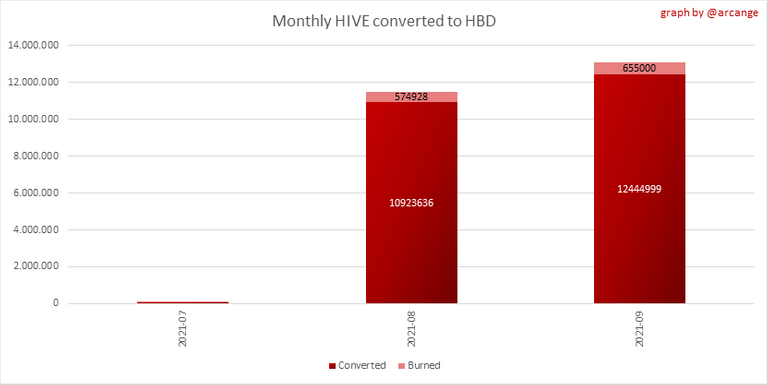 |
These graphs show the number of HIVE effectively used by the conversion process (HIVE converted and 5% HIVE fee which is burned) each day and month when requests to convert HIVE to HBD have been finalized.
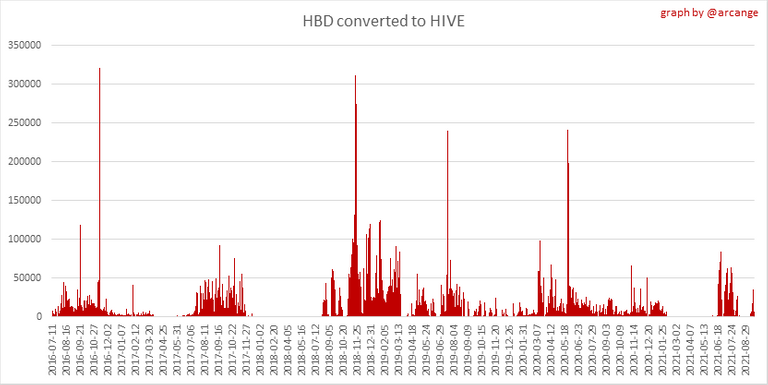 | 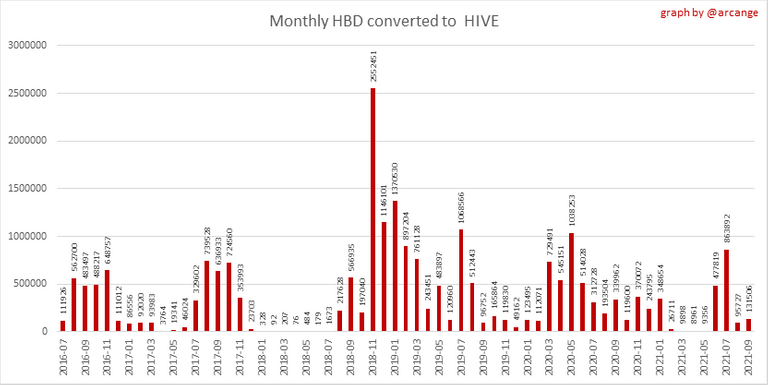 |
These graphs show the number of HBD burned, each day and each month, following requests to convert HBD to HIVE.
6. Powerup and Powerdown
| Date | Account | Amount |
|---|---|---|
| 2021-09-19 03:50:42 | @birdwatcher | 150,433.514 HIVE |
| 2021-09-19 07:24:42 | @littleboy | 23,001.327 HIVE |
| 2021-09-19 10:38:45 | @endless.drugs | 7,003.205 HIVE |
| 2021-09-19 02:22:54 | @andywong31 | 6,651.578 HIVE |
| 2021-09-19 04:30:36 | @paradigmprospect | 6,322.428 HIVE |
| 2021-09-19 09:02:57 | @l337.crypto | 5,315.934 HIVE |
| 2021-09-19 12:31:48 | @starstrings01 | 4,019.327 HIVE |
| 2021-09-19 12:22:45 | @cesaramos | 3,725.455 HIVE |
| 2021-09-19 02:04:12 | @binhtien | 3,031.356 HIVE |
| 2021-09-19 09:01:54 | @dwcrypt7g | 2,342.122 HIVE |
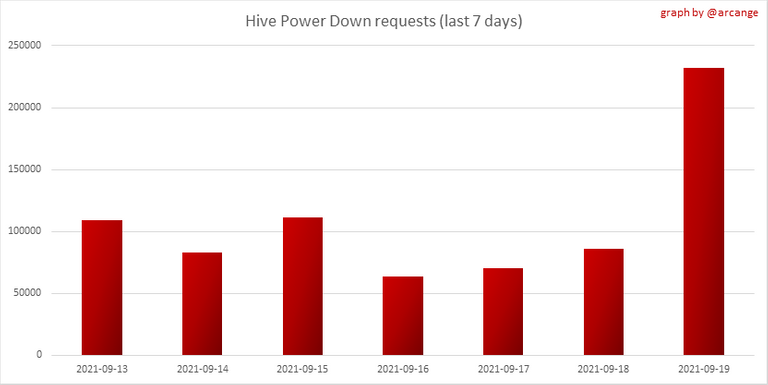
This graph and table show the amount of powerdown initiated over the last 7 days, and the largest initiated on this day.
| Account | Powerup | Account | Powerdown |
|---|---|---|---|
| @healthsquared | 10,000.000 HIVE | @appreciator | 17,030.171 HIVE |
| @joerhino | 1,346.060 HIVE | @sanjeevm | 5,952.946 HIVE |
| @kingscrown | 1,000.000 HIVE | @janusface | 5,014.167 HIVE |
| @ace108 | 888.000 HIVE | @kingfadino | 3,996.685 HIVE |
| @matt-archy | 723.930 HIVE | @mintdice | 3,489.693 HIVE |
| @charlie80 | 700.466 HIVE | @thecryptodrive | 3,277.056 HIVE |
| @marcusen | 600.000 HIVE | @mahdiyari | 3,012.277 HIVE |
| @onealfa | 562.000 HIVE | @ew-and-patterns | 2,542.154 HIVE |
| @digital-fortress | 500.000 HIVE | @steempeak | 2,440.814 HIVE |
| @marcosdk | 457.036 HIVE | @curie | 1,503.581 HIVE |
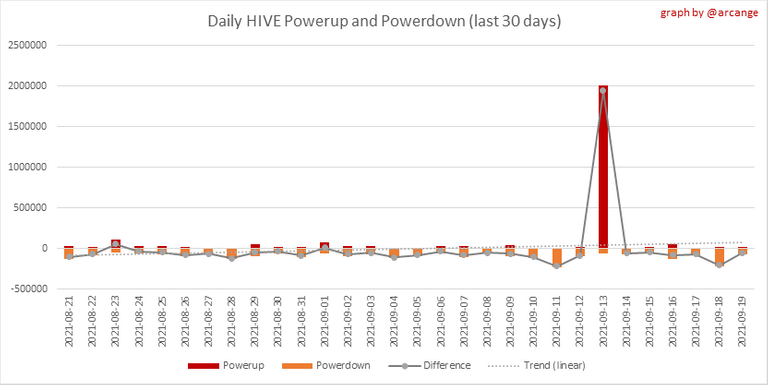
This graph shows the daily HIVE power-up, power-down, and the resulting variation over the last 30 days. The table shows the topmost power-ups and power-downs of the day.
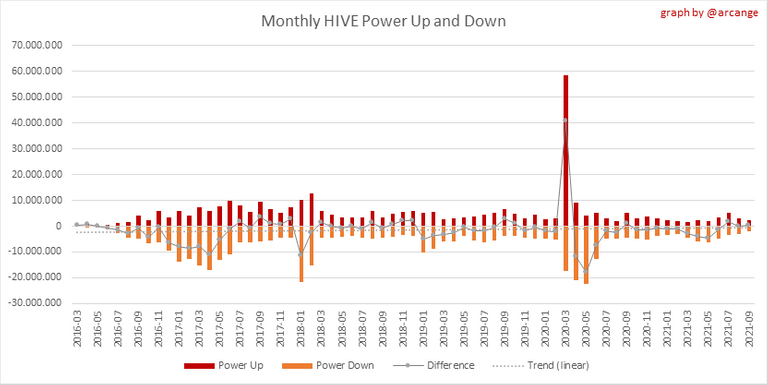
This graph shows the monthly HIVE power-up, power-down and the resulting variation.
Values for the last 3 months
| Period | Powerup | Powerdown | Difference |
|---|---|---|---|
| 2021-09 | 1,948,294.000 | 2,421,484.000 | 473,190.000 |
| 2021-08 | 3,144,598.000 | 3,212,814.000 | 68,216.000 |
| 2021-07 | 3,415,366.000 | 5,186,384.000 | 1,771,018.000 |
7. Transfers
These graphs show the volume (in USD) of HIVE and HBD transferred between accounts.
8. Exchanges
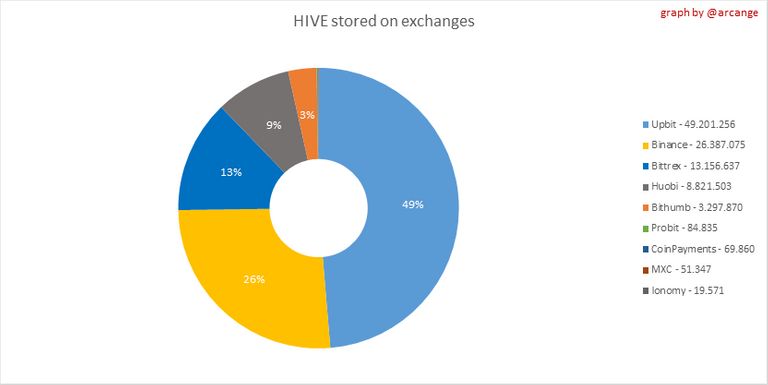 | 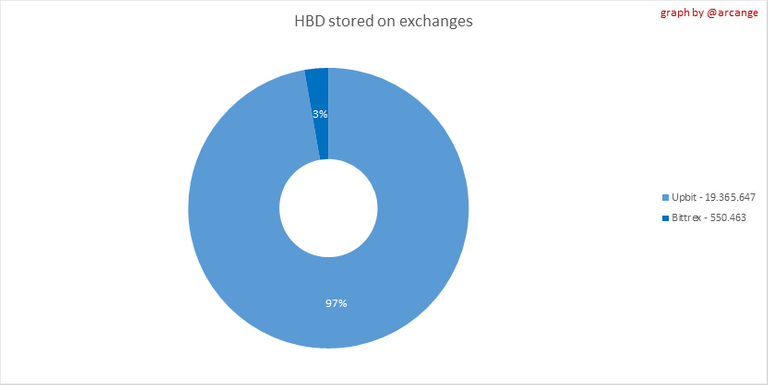 |
These graphs show the amount and distribution of HIVE and HBD stored on the exchanges where they are listed.
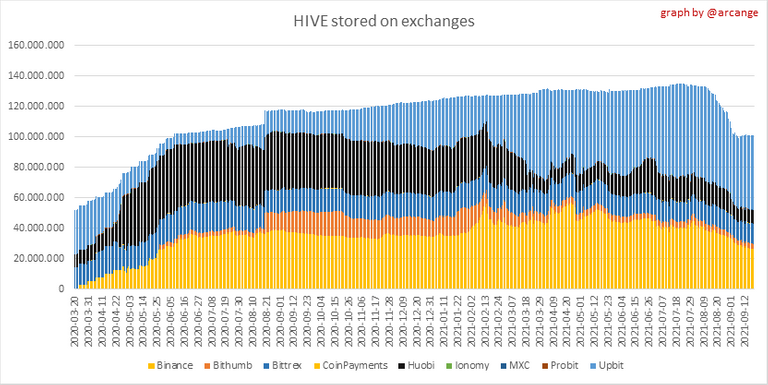 | 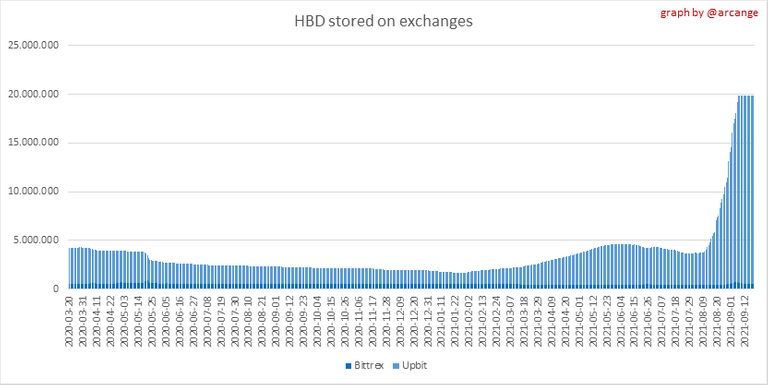 |
These graphs show the daily evolution of HIVE and HBD stored on the exchanges where they are listed.
I hope you find those stats useful. If you would like to see additional stats, feel free to drop me a comment. Your feedback is than welcome.
Thanks for reading.
Check out my apps and services


Electronic-terrorism, voice to skull and neuro monitoring on Hive and Steem. You can ignore this, but your going to wish you didnt soon. This is happening whether you believe it or not. https://ecency.com/fyrstikken/@fairandbalanced/i-am-the-only-motherfucker-on-the-internet-pointing-to-a-direct-source-for-voice-to-skull-electronic-terrorism
Appreciate the mention and the stats are very informative.
I have a question. There used to be a site one could go to to find stats for their own account, like traffic stats such as what time of day a post received the most votes, comments etc.
Do happen to know where to find that information? I lost track of it.
Maybe this is what you are looking for: https://hivetasks.com/@joerhino
That is exactly it. Thank you so much.
Wow, stuff Is really lagging in trying to load. Server must be having some issues. I will try again later. Thanks again though, really. That is exactly what I was looking for. Some of those other tools are also pretty useful as well.
Yeah, looks like something is wrong here. Stats are not all loading right. Especially under the account operations section. Oh well, maybe something will come along.
finally i am number 1 in something! hahah cheers dude!
Congrats @xmauron3 🎉😂
!PIZZA
!BEER
@arcange! I sent you a slice of $PIZZA on behalf of @eii.
Learn more about $PIZZA Token at hive.pizza (1/10)